Production of Nutritional Bars with Different Proportions of Oat Flour and Brown Rice Flour
Nguyen Van Toan, Tran Quang Vinh
Citation : Toan NV, Vinh TQ. Production of nutritional bars with different proportions of oat flour and brown rice flour. Clin J Nutr Diet 2018;1(1):1-11.
Nutritional bar has been paid special attention, then quickly developed and present in some parts of the world as it contains high nutritional value, quick energy release on required demanding basis, especially the form of this food is very mobile and neatly light. Nutritional bars are nutritional products which contain cereals and other high energy-rich ingredients. They are becoming trendy food products in the world in these days. They can be used as the nutritional meal, meal replacement, or snack which provides a lot of essential nutrients for people who lack the time or resources for extensive meal planning due to its convenience.
The purpose of this study is to determine the suitable process for a preparation and a possible replacement to reduce the production costs of oat flour by brown rice flour in the processing of nutritional bars.
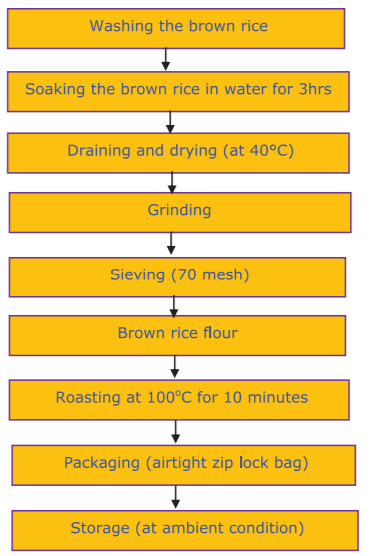
The collected samples of brown rice were sorted and soaked in clean water with a ratio of the rice to water of 2:3 (W/W) at ambient temperature for 3 h. They were then drained and dried in an oven dryer at 40°C for 4-5 h until the level of moisture content drops around 12-16%. Then, they were ground using a laboratory grinder. The dried flour samples were passed through a 70-mesh sieve and roasted on pan at 100°
C for 10 min before stored in a plastic bag at ambient condition for further use.
Nutritional analysis of the prepared nutritional bar showed that the developed nutritional bars from brown rice flour were scientifically necessary to reduce the production costs while remained the specific nutritional values and health benefits as well as the high acceptability of the consumers.
The potential substitution of oat flour by brown rice flour in nutritional bar by evaluating the nutritional values as well as the physical parameters of the resulting products were thoroughly investigated and successfully obtained.
Brown rice flour, nutritional bars, nutritional values, oats flour, physicochemical analysis, production cost, sensory evaluation, total phenolic compounds,asclepiusopen
INTRODUCTION
Among the variety of rice, brown rice is well known as its high in nutritional values when compared to whole white rice. Brown rice is the whole grain with the removing of an inedible outer shell[1]. The nutritional components in brown rice mainly exist in the germ and bran layers, which are mostly removed by polishing as an outcome[2]. Although carbohydrates are the main components in brown rice, it has a low glycemic index which is indicated low digestibility of the starch. Besides, brown rice is an excellent source of functional components which contains important nutrients such as bioactive components, B-complex vitamins, dietary fiber, and minerals, of which could provide and promote human health[3]. Scientific studies have been now shown that the consumption of brown rice in human and animal reduces the risk of type-2 diabetes, heart diseases, cancer, and other chronic diseases[2,4]. In the food industry, brown rice was found that it has the potential for the production of various human foods due to its suitable form[5]. Brown rice is well known for the whole rice grain that has undergone the dehulling process. Without dehulling process, the bran layer is still bound up with the grain. Hence, brown rice is more nutritious than milled rice[5,6]. In addition, the bran layer of brown rice contains various nutrients that are necessary for poultry as well. It has been worth noting that without passing a milling process, the processing cost will be reduced. Thus, the price is lower[5] and thus lowering the price. For those reasons, brown rice has a promising application as well as a source for commercial poultry production[7].
Moreover, in microbiological field, due to its economical and beneficial application, some scientific studies have shown that brown rice or its rice bran is used as media which can directly be used as fermentation substrates of probiotic bacteria. Brown rice contains the high level of essential nutrient and bioactive compound to promote the growth of probiotic bacteria such as Lactobacillus acidophilus, Lactobacillus pentosus, and Lactobacillus plantarum[8,9]. Consequently, the value of the cereal processing industry could be increased by the using of brown rice bran or its extracts as the replacement source of non-dairy probiotics[8].
The application of certain types of brown rice flour depends on the characteristics that are important to particular food products. In some food processing such as snack foods, cookies, gravies, pudding, bread, and cakes, brown rice flours were added to reduce the production costs and increase the dietary fiber content. Because of the absence of gluten, low amounts of fat, sodium but high amounts of digestible carbohydrates, brown rice flour has been used as the replacement for wheat flour in the production of gluten-free cakes to help people with celiac disease and other related diseases[10].
In the time of advanced information and technology today, global food consumers are well aware of health benefits from instant and fabricated foods, which contain high essential nutrients that could promote human health and prevent consumers from chronic diseases. As the consequence, a rather new type of food product named: Nutritional bar has been paid special attention, then quickly developed and present in some parts of the world as it contains high nutritional value, quick energy release on required demanding basis, especially the form of this food is very mobile and neatly light. Nutritional bars are nutritional products which contain cereals and other high energy-rich ingredients they are becoming trendy food products in the world in these days. They can be used as the nutritional meal, meal replacement, or snack which provides a lot of essential nutrients for people who lack the time or resources for extensive meal planning due to its convenience. According to Global Market Study on nutritional bars, more than 40% of the global market value was accounted by North America and the trend still increase gradually. Although nutritional bars development in this market is almost saturated, the USA is still the largest market for this food industry. In Europe, due to the increasing of appropriation for the nutritional products, the high demand for this bar has recently seen in the United Kingdom[11]. In Asia-Pacific region, the high nutrient bars market got the most significant increase from the countries in the East side included China, Japan, Korea, and Taiwan due to the raised attention among teenagers about their looks. The Chinese market is predicted to observe the fastest growth during the forecast period, followed by Japan. Australia is another country to have a look into, due to the presence of a large number of sportsmen and athletes who prefer nutritional bars as nutritional food with high nutrients. In addition, Vietnam is a potential market with the broad field of young and energetic consumers, which occupy for the majority of the workforce in the country and difficulty finding time for traditional cooking due to their busy time[12].
Oat flour is the primary ingredient which is usually used in nutritional bar in order to enhance the dietary fiber content as well as some micronutrients. Dietary fiber, particularly oat β-glucan has potential anticancerous property, as they reduce compounds which are causative agents of colon cancer reduce blood cholesterol level as well as reduce blood pressure[13].
Although numerous studies on the evaluation and utilization of rice in general, and brown rice in particular, have been conducted as mentioned above, there is no information about how to prepare flour and the made nutritional bars from brown rice. Besides, the production costs of this bar are quite exorbitant due to the import of oat flour from overseas. Therefore, the use of brown rice flour which is abundant in Vietnam market will be investigated to find the most suitable ratios to substitute the role of oats in order to reduce the production costs as well as maintain the quality of nutritional bars. Hence, it is scientifically and economically important to know whether the made flour from brown rice can be used for the production of nutritional bar with a possible maximum alleviation of production expense. In addition, consequence of various proportion of brown rice flour to oat flour formation needs to be determined in order to produce acceptable final nutritional products. In summary, this study has been conducted to determine the suitable process for preparation and possible replacement to reduce the production costs of oat flour by brown rice flour in the processing of nutritional bars.
MATERIALS AND METHODS
The brown rice samples were collected and sorted to remove any foreign matter present in the grain. The samples were then soaked in water with a ratio of rice to water of 2:3 (w/w) at room temperature for 3 h. After that, they were drained and dried in an oven dryer at 40°C for 4-5 h until the level moisture content drops around 12-16%[1]. Then, they are ground using a laboratory grinder. The dried flour samples passed through a 70-mesh sieve and roasted on pan 100° for 10 min before stored in a plastic bag at ambient condition for further use [Figure 1][2,14].
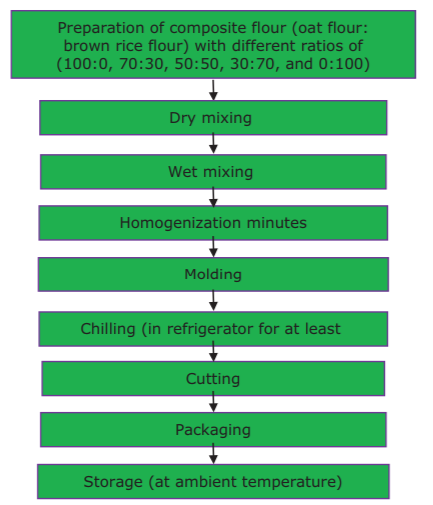
The oat flour and brown rice flour were mixed with different proportions (100:0, 70:30, 50:50, 30:70, and 0:100) and other dried ingredients were weighted and added in a medium bowl. Peanut butter and honey were combined in a small bowl, then they were heated until solution becomes melted. The following wet ingredients and water were mixed with the dry ingredient to make a homogenized mixture. The mixture was spread into baking dish and entirely wrapped. The baking dish was placed in refrigerator for at least 2 h until becoming hard. The obtained bars from the dish were taken out by lifting up the parchment and cut into squares. The nutritional bars were stored in airtight containers for at least 12 h before further analysis. The flowchart for preparation of nutritional bars is shown in the Figure 2
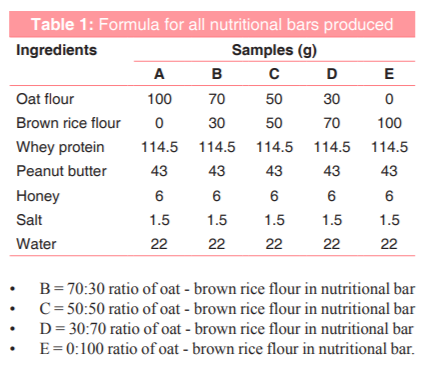
As shown in the all well-prepared Table 1, A is symbol marked nutritional bars produced from 100% oat flour. Similarly, B is marked nutritional bars produced from 70% oat and 30% brown rice flour, C is marked nutritional bars produced from 50% oat and 50% brown rice flour, D is marked nutritional bars produced from 30% oat and 70% brown rice flour, and E is marked nutritional bars produced from 100% brown rice flour.
The proximate analysis of the composite flours and nutritional bar moisture, protein, ash, fiber, and fat content were determined to the methods described using the AOAC[15]. Total carbohydrates were calculated by difference[16].
Total carbohydrate content: Total carbohydrates were calculated by difference[16].
% Carbohydrate = 100% (protein+ fat + ash+ fiber + moisture) Crude fiber: Total dietary fiber was determined according to Approved Methods of American Association of Cereal Chemists. 9th ed. St. Paul: AACC, 1995[17].
Bulk density was determined according to the method reported by Okaka and Potter, 1977[18].
The WAC of the sample was determined using the method as described by Eleazu and Ironua[19] and Onabanjo and Dickson[20] with a minor modification.
OAC of the flour was determined using the method as described by Adepeju et al.[21]and Eleazu and Ironua, 2013[19].
Moisture, carbohydrate, fiber, ash, protein, and fat content of prepared nutritional bars were determined by the same methods used for brown rice flour analysis.
Total phenolics were extracted from the samples following the method described by Yafang et al., 2011[22] with a slight modification.
The length, width, thickness, weight, volume, and density of different treatments nutritional bar were measured
1. Thickness was measured by stacking 3 nutritional bars on top of each other.
2. Length was measured by laying 3 nutritional bars edge-to-edge to get the average length (cm)
3. Width was measured by laying 3 nutritional bars next to each other to get the average width (cm)
4. Weight was measured using digital weighing scale to determine the weight (grams)
5. Volume of nutritional bar is defined as the area of the bar multiplied by thickness.
Volume = L*T*W where
T = Average thickness of bar (cm) L = Length of bar (cm) W = Width of bar (cm).
6. Density was obtained using the following formula.
Sensory evaluation of the product was conducted based on 9 points hedonic scale for appearance, color, flavor, texture, and overall acceptability. A semi-trained panel of 60 members was selected to evaluate the sensory properties of nutritional bars. The sensory evaluation was performed in laboratory with clean sensory cabinets containing fresh water. The panelists were instructed to evaluate the above attributes of the samples and to rate each attribute. A 9-point hedonic scale with 1 (dislike extremely) and 9 (like extremely) was used[2].
All experiments were performed in triplicate. Data are expressed as the mean values ± standard deviation derived from triplicate determinations. The statistical analysis of the data was done by analysis of variance using the software Minitab version 16 (Minitab Inc., USA). The results were significant differences for P < 0.05.
RESULTS
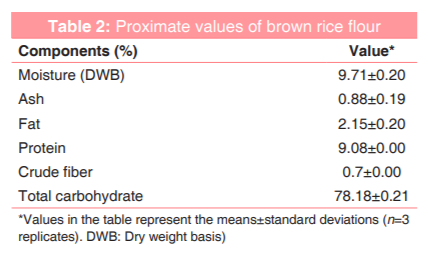
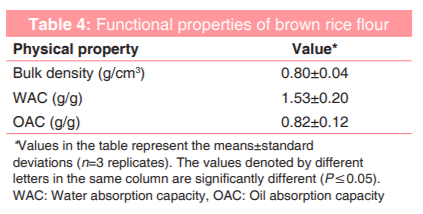
Proximate analysis of brown rice flour is shown in the Table 2. Moisture content is known as an important factor that affects the quality and palatability of brown rice grains. As can be seen from Table 2, the moisture content of the brown rice flour (dry weight basis) was 9.71 ± 0.2%.
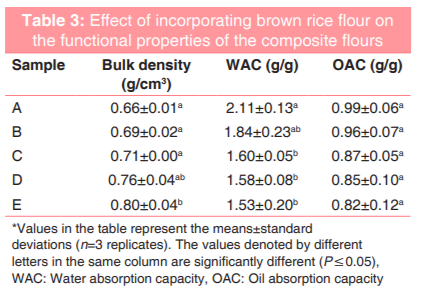
The results of the functional properties of brown rice flour and the composite flour samples are as presented in Tables 3 and 4.
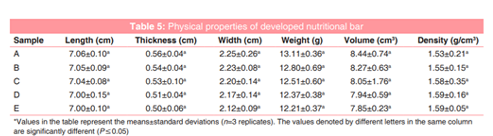
Physical properties of developed nutritional bars: The collected data on physical properties of developed nutritional bars are presented in Table 5.
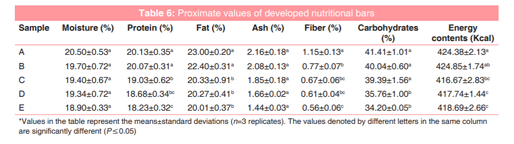
Proximate values of developed nutritional bars are shown in the Table 6, providing that the moisture contents of the five formulations ranged between 18.90% and 20.50%. The results also revealed that there was a gradual decrease of moisture content of nutritional bars from sample A to E. As mentioned in the previous part, Oat flour has higher water absorption capacity than brown rice flour (2.11 g/g > 1.53 g/g).
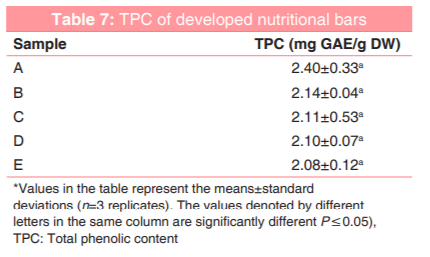
The estimated values of total phenolic content (TPC) in the studied nutritional bars are given in Table 7. As it can easily be seen, from the collected data, while increase the level of brown rice flour substitution in nutritional bars processing, the total phenolic content (mg/g DW) gradually decreased. The total phenolic contents (mg/g) in the different formulations of the sample extracts were calculated using the standard curve for gallic acid with the equation y = 0.0929x + 0.0142, R2 = 0.9989.
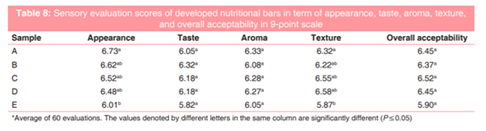
Sensory evaluation scores of developed nutritional bars in term of appearance, taste, aroma, texture and overall acceptability in 9 - point scale.are presented in the Table 8.
DISCUSSION
From Table 2, data on proximate analysis of the prepared brown rice flour clearly showed that brown rice is well-known rich in fatty acid which mainly presented in bran and part of germ[23]. Fat in brown rice is a good source of linoleic and other essential fatty acids but does not contain cholesterol[24]. The result of fat content in the current study was 2.15 ± 0.20% which was in an agreement with that of Grist[25] who reported the ranged for fat contain between 2.0% and 2.54%. Fat content influences the taste of cooked rice because rice with high-fat content tends to be tastier and have less starch[26].
Brown rice protein is superior because of its unique composition of amino acids and has a special benefit because eight of the essential amino acids had been found in delicately balanced proportions[27]. Protein in brown rice is very essential as proteins form the basic building blocks for cells and tissue repairs in the body.[28] Besides, the nutritional quality of rice could be determined by the protein content[8]. The collected data in the current study was 9.08% within the protein ranged from 7.3 to 11.9% of which is similar to the one reported by Gunaratne et al.[29] With considerably higher amount of protein than polished rice, brown rice is considered as good a source of ingredient which is really interesting for food products and people suffering from protein malnutrition[30].
It is known that the main benefit of fiber is to low down the blood cholesterol and sugar after meals in diabetic patients[31]. Fiber can reduce the risk of bowel disorders and fights against constipation[32]. An absence or low fiber in daily meal could lead to the high incidence of a wide range of diseases in man[33]. The presence of fiber in diet increases the bulk of feces, which has a laxative effect in the gut. The analyzed fiber content was 0.7% within the range 0.2-2.6% reported by Julialo, 1972 which is acceptable. Hence, the consumption of brown rice flour is associated with beneficial health effects which are attributed to the high content of dietary fiber[34].
Brown rice is considered as good source of carbohydrate, though carbohydrates are the main components in brown rice, it has a low glycemic index which is indicated low digestibility of the starch and shown no side effects on the consumption of human (Ito et al., 2005). Moreover, standing at 78.18 ± 0.21%, the collected data of total carbohydrate in brown rice is marginally different within the range 79-91.4% reported by Grist[25]. The differences observed in this case may be due to the following reasons are varietal differences, agro-ecological condition, extent of drying, fertilizer use and methods of analysis, etc.[1]
As can be easily seen from Tables 3 and 4, the functional properties are the fundamental physicochemical characteristics that reflect the complex interaction between the composition, structure, molecular conformation, and physicochemical properties of food components together with the nature of environment in which these are associated and measured[35]. Functional characteristics are required to the general quality of foods and provided useful information for industrial purpose as well as their acceptability. The functional properties of flours also play important role in the manufacturing of bakery products[1].
Bulk density of oat flour (Sample A) was 0.66 g/cm3, whereas that of brown rice flour recorded 0.80 g/cm3. Based on the collected data, the high amount of brown rice flour was incorporated with oat flour, the higher density of the composite flour in the results. The bulk density values ranged between 0.66 and 0.80 g/cm3. While sample E was the highest value in bulk density, the opposite was true for sample A. The values of this parameter were reported significantly different (P = 0.05) between sample A and E.
Density of food materials is useful in mathematical conversion of mass to volume as an important parameter to assess the quality of food materials[36]. Bulk density is generally affected by the particle size and density of the flour, the higher the particle size, the lower the bulk density. Increase in bulk density is desirable because its advantages in packaging processing as well as remain a constant volume of packing quantity during distribution[37].
From Table 3, the WAC of composite flour was shifted toward downward trend. There were significant differences (P = 0.05) in the WAC of sample C, D, and E comparing with the control sample A, though the result from sample B was similar with all proportions. Besides, the WAC of composite flours was ranged between 153% and 211% with the highest value regarded to sample A and the lowest one was sample B. Chandra et al. proposed this could be due to molecular structure of the rice flour which inhibited water absorption and less availability of polar amino acids in flours as could be seen from the lower values of WAC. Berggren et al.[38] and Nikolic et al.[39] also figured out the reduction of dietary fiber and protein content from oat to brown rice flour might impact to the WAC.
OACAlso from Table 3, it can be seen that the OAC of all composite flours ranged between 82% and 99%. Sample A was considered highest OAC value, whereas that of sample E was lowest. There were no significant differences (P > 0.05) in the OAC of all composite flours. OAC of flour was attributed to the physical entrapment of oil by capillary attraction that acts as flavor retainer and increases the mouthfeel of food (Singh et al., 2017). The change in OAC in different composite flour could be explained by the quality of proteins and amino acid. These components combine with dissociation and fractional unfolding of polypeptide in order to expose the hydrophobic sites of amino acids and adjusted lipophilic protein which aids hydrophobic association with the fat molecules[40]. Hence, the low protein content in brown rice flour in order to compare with oat flour is the possible reason for the drop in the OAC of composite flours when raising the level of substitution.
The obtained results of physical properties of developed nutritional bars from Table 5 shows that the length, the width, and the thickness of nutritional bars made from oat and brown rice flour in different ratios were not significantly different (P > 0.05), though there was a downward trend from these parameters. This fact could be explained by the method of producing nutritional bars. Without baking, the temperature did not affect the desirable shape of the products. The added whey protein isolate is the main ingredient to form the structure of the nutritional bars.The used whey protein, of which incorporated with fructose from honey helps making other components in the made nutritional bars rather good and consistent shape during chilling time.(Adams, 2008). When changeing in theratio of oat to brown rice, the resulting content of protein and fibers are prettily influenced and lead to slightly changed in the volume, weight and density of the made nutritional bars.
The volume of nutritional bars ranged from 7.85 to 8.44 cm3, with the highest value was seen in sample A and the lowest value was of sample E. The higher replacement of oat flour by brown rice flour, the lower volume of the bars. However, there was no significant difference (P > 0.05) in different ration of oat and brown rice flour. The explanation for the decrease of the bars might due to the slightly reduce in fiber content from oat to brown rice which affects to the amount of absorbed water[38]. The lower water absorption might interfere to the ability of dough cooperate with air during mixing[41]. Density of bar was moderately increased directly with brown rice flour content substitution. The nutritional bars with 100% of brown rice flour had the highest density about 1.59 g/cm3, while the lowest density value (approximate 1.53 g/cm3) was found in bars contained 100% of oat flour. However, there was no significant difference with all composite flour in term of density (P > 2005). This fact could be explained by the increases in density caused by decrease in the air volume incorporated into the batter. These results were similar to the previous study by Varavinit and Shobsngob[42] who found density values of bar samples added with brown rice flour were higher than those of oat. Density was the good criterion of the sensory texture of nutritional bars. Lower density means greater firmness and higher textural value (Dogan, 2006).
The weight of the experimental nutritional bars was between 12.21 and 13.11 g with the highest value was of sample A and the lowest was found in sample E. There was insignificant difference among samples (P > 0.05). As observing the results in Table 5, sample A with 100% oat flour which higher in fiber content and β-glucan content which indicated higher water holding capacity, hence, this resulted in the difference in term of weight of all samples (Berggren S., 2018)[43].
In summary, although there are differences between nutritional bars with different composite flour in terms of physical parameters, these differences are not significant by statistical analyzing, providing that it is a good evidence in order to support the potential of brown rice substitution in nutritional bars processing.
As shown in Table 6, the moisture contents of the five formulations were in the range of 18.90% and 20.50%. This value range revealed that there was a gradual decrease of moisture content of nutritional bars from sample A to E. As mentioned in the previous part, oat flour has higher WAC than brown rice flour (2.11 g/g > 1.53 g/g). Thus, the nutritional bars contained more brown rice flour had higher affinity for water which was informed by their lower moisture content[43,44]. However, there was no significant difference in moisture between the control sample A and other formulas in the nutritional bars formulation (P > 0.05). The study carried out by Santos et al.[45] showed the moisture content on his cereal bars varied from 20.26% to 21.40%. In comparison with collected data, it showed that the moisture contents in this work were better than that of Santos et al.[45] because the self-life of the product could be extended by lower moisture contents. Nutritional bars with low value of moisture contents could be stored for a long period of time without spoilage and stronger ability to restrain the microbial growth[46].
Also from Table 6, the collected data on fat content was in the range of 20.01% and 23.00% which was the highest concentration of fat seen in the bars A. Although the results were similar among sample A and B, there were significant differences (P = 0.05) in the fat content of nutritional bars when increasing the amount of brown rice flour in comparison with the control sample A. This fact could be explained by the difference in fat content between oat flour and brown rice flour. The fat contents of the oat flour carried out by Choi et al., 2012 ranged between 7.89% and 10.01%, which was four times as much as the brown rice flour's fat content (2.0% and 2.54%) reported by Grist. The results of fat content of nutritional bars obtained under this work were higher than the those obtained in the work of Zamora-Gasga et al.[47] of 14.17% and 15.60%. The slightly higher fat contents in the bars might have an important role in order to replace the energy used during physical activities as a result of the exhausted energy during exercise[48]. Besides, products with higher fat contents could enhance the mouthfeel and retain flavors of product[49].
The protein contents of the nutritional bars were high. Whey protein powder, which was the main ingredient of the nutritional bars which made up approximately 40% of the total bar composition, generally contain high protein content more than 80%.[50] The protein contents under this study were in range of 18.23% and 20.13% which were much higher compared to the values of cereal bars in the study of Agbaje et al.[51] As can be seen from Table 6, the data on the protein showed the significant difference in the formulations P = 0.05). The higher amount of brown rice substitution, the lower protein content compared to the control sample A. The research reported by Choi et al.[52] has also shown the protein of oat flour varied from 11.51 to 14.37 which higher than the protein content of brown rice in this experiment, resulting to the total protein content of nutritional bars. In general, the results of protein obtained with the nutritional bars in this study are close to those of commercial bars on the market, which is on average 25%. A study carried by Wu[53] showed that Adequate consumption of high-quality protein is essential for optimal growth, which is essential to support bone growth in infants and children and to sustain the mass and health of the skeleton in adult development, and health in humans.
Ash content is an index which expresses the mineral content in the food products. Although the collected ash contents under this study varied between 1.44% and 2.16% with sample A was highest in ash content and sample E was lowest one, there was no significant difference among trial samples. The results of ash content were in an agreement with the study carried out by Cecchi[54] who found that the level of ash contents in cereal bars was between 0.30% and 3.30%. The nutritional bars made from oat and brown rice flour under this study showed the significant ash contents, which contributed to the good supply of minerals in the bars.
The collected data on the crude fiber [Table 6] of the prepared nutritional bar varied from 0.56% to 1.15%. The highest value of crude fiber was found in the control sample A (1.15%) with 100% oat flour and the lowest were seen in sample E (0.33%) with full replacement of oat by brown rice flour. It has been known that the oat flour is higher in fiber contents as opposed to brown rice flour, which causing the trendy decrease crude fiber in nutritional bars. Using statistic, there were significant differences among five formulations in crude fiber contents (P ? 0.05). However, in a study reported by Reader et al.[55] showed that the traditional energy bars contain < 1% of crude fiber, which was in agreement with the collected results in this experiment. The supplement of fiber content in food product is a welcome measure for people who are suffering with high blood pressure and diabetes. Anderson et al.[56], showed in their study that people who consume significant amounts of dietary fiber would have health-protective effect such as good regulation and control of blood pressure as well as blood glucose in some diabetic cases.
The energy contents of the nutritional bars formulated with oat flour and brown rice flour under this study varied between 418.69 Kcal and 424.38 Kcal [Table 6]. These values of the nutritional bars were statistically significantly different (P ? 0.05). The caloric contents express the energy derived from macronutrients including proteins, carbohydrates, and fats. With the differences among trial samples in term of nutrients, the caloric contents were also influenced. Besides, the results for energy contents of nutritional bars of this study were in an agreement with the observation of Carvalho et al.[57]
The data on TPC of the developed nutritional bars are given in Table 7. As it can easily be seen, increase in the level of brown rice flour substitution in nutritional bars processing, the TPC (mg/g DW) gradually was decreased. The TPC (mg/g) in the different formulations of the extracted samples were calculated using the standard curve for gallic acid with the equation y = 0.0929x + 0.0142, R2 = 0.9989. The obtained TPC was ranged between 2.08 and 2.40 mg gallic acid equivalent (mg GAE)/g DW, whereas the value of the control sample A was of 2.40 mg GAE/g DW. Hodzic et al.[58] and Hung[59] revealed that the TPC is varied when measuring in buckwheat rye, oats, barley, corn, wheat, and rice. Using different preparation methods included solvent selection, extraction time, and temperature, they found that content of total phenols and bound phenols in rice varieties was the smallest, which explains why there was a downward trend in TPC among different samples. However, there were no statistically different (P > 0.05) among these samples in comparison with the control sample A.
Oat and brown rice are well known as their rich in TPC. They are rich in phenolic compounds which possess antioxidant capacity[59]. The phenolic compounds were found to play an integral part in human health with fighting against oxidative stress by maintaining a balance between oxidants and antioxidants, and so providing adequate amount of the phenolic compounds in human diet are best known to support the human body which reduced oxidative damage of lipid and low-density lipoproteins in order to inhibit platelet aggregation[60]. Besides, coronary heart disease and cancer risk could be protected by the antioxidant properties of phenolic compounds (Hung PV, 2016;[49] Martinez-Valverde et al., 2000;[61] Newmark, 1996[62]).
The five formulations were evaluated by 60 consumers of nutritional bars on the acceptability of the appearance, taste, aroma, texture, and overall through 9-point hedonic scale[63] (9 = like extremely, 5 = neither like nor dislike, 1 = dislike extremely).
The sensory characteristics of nutritional bars prepared from oat flour and brown rice flour are shown in Table 8. In overall, although the sensory scores for taste, aroma, texture, appearance, and overall acceptability of nutritional bars decreased with the increase in the level of brown rice flour in the formulation, there were no significant differences in taste, aroma, and overall acceptability between control nutritional bars and bars containing brown rice flour (P > 0.05). However, the appearance and texture scores of control bars and bars with 100% brown rice flour were statistically different. The score of appearance and texture reduced from 6.73 to 6.01 and from 6.32 to 5.87, respectively, when substituting oat flour by 100% brown rice flour. This was because of protein reduced with the replacement of brown rice flour. The proteins in nutritional bars play an integral part to form the shape when combination with binding agents such as honey and water. The reduction in protein from brown rice affected to the total protein in bars which influenced to the textural strength of nutritional bar products.
CONCLUSION
In this study, the potential substitution of oat flour by brown rice flour in nutritional bars by evaluating the nutritional values as well as the physical parameters of resulting products were successfully and thoroughly investigated. The obtained results of this study indicated that the developed nutritional bars from brown rice flour were scientifically necessary to reduce the production costs while still remain the nutritional values and health benefits as well as the high acceptability of the consumers.
REFERENCES
- Islam MZ, Ud-Din MS, Haque MA. Studies on the effect of brown rice and maize flour on the quality of bread. J Bangladesh Agric Univ 2012;9:297-304.
- Mir SA, Bosco SJ, Shah MA, Mir MM, Sunooj KV. Variety difference in quality characteristics, antioxidant properties and mineral composition of brown rice. J Food Meas Charact 2016;10:177-84.
- Ito Y, Mizukuchi A, Kise M, Aoto H, Yamamoto S, Yoshihara R, et al. Postprandial blood glucose and insulin responses to pre-germinated brown rice in healthy subjects. J Med Invest 2005;52:159-64.
- Kim HY, Hwang IG, Kim TM, Woo KS, Park DS, Kim JH, et al. Chemical and functional components in different parts of rough rice (Oryza sativa L.) before and after germination. Food Chem 2012;134:288-93.
- Alias I, Ariffin T. Potential of feed rice as an energy source for poultry production. In: Proceedings of Workshop on Animal Feedstuffs in Malaysia: Exploring Alternative Strategies, Putrajaya, Malaysia; 2008. p. 31-8.
- Rosniyana A, Rukunudin IH, Norin SA. Effects of milling degree on the chemical composition, physico-chemical properties and cooking characteristics of brown rice. J Trop Agric Food Sci 2006;34:37.
- Asyifah MN, Abd-Aziz S, Phang LY, Azlian MN. Brown rice as a potential feedstuff for poultry. J Appl Poultry Res 2012;21:103-10.
- Saman P, Fucinos P, Vazquez JA, Pandiella SS. Fermentability of brown rice and rice bran for growth of human Lactobacillus plantarum NCIMB 8826. Food Technol Biotechnol 2011;49:128-32.
- Trachoo N, Boudreaux C, Moongngarm A, Samappito S, Gaensakoo R. Effect of germinated rough rice media on growth of selected probiotic bacteria. Pak J Biol Sci 2006;9:2657-61.
- Alhusaini SS. Modification of Rice Flour and Its Potential Use in the Food Industry. LSU Historical Dissertations and Theses. 4038.1985.
- Protein Bar Market - Segmented by Type, Source, End Product, and Geography (2018 - 2023). Available at https://www. mordorintelligence.com/industry-reports/protein-bar-market
- United States Snack Bar Market - Growth, Trends and Forecasts (2018 - 2023). Available at https://www.mordorintelligence. com/industry-reports/snack-bars-market-industry
- Rasane P, Jha A, Sabikhi L, Kumar A, Unnikrishnan VS. Nutritional advantages of oats and opportunities for its processing as value added foods - A review. J Food Sci Technol 2015;52:662-75.
- Baek JJ, Lee S. Functional characterization of brown rice flourin an extruded noodle system. J Korean Soc Appl Biol Chem 2014;57:435-40.
- Gaithersburg MD. Official Methods of Analysis of AOAC International. 8th ed. Gaithersburg, MD, USA: AOAC International; 2012.
- Murthy GK, Kaylor LO. Evaluation of APHA and AOAC II methods for phosphatase in butter and differentiation of milk and microbial phosphatases by agarose-gel electrophoresis. J Assoc Off Anal Chem 1990;73:681-7.
- Merican Association of Cereal Chemists - AACC. Approved Methods of American Association of Cereal Chemists. 9th ed. St. Paul: AACC; 1995.
- Okaka JC, Potter NN. Functional and storage properties of cowpea powder-wheat flour blends in breadmaking. J Food Sci 1977;42:828-33.
- Eleazu C, Ironua C. Physicochemical composition and antioxidant properties of a sweetpotato variety (Ipomoea batatas L) commercially sold in South Eastern Nigeria. Afr J Biotechnol 2013;12:720-7.
- Onabanjo OO, Dickson AI. Nutritional, functional and sensory properties of biscuit produced from wheat-sweet potato composite. J Food Technol Res 2014;1:111-21.
- Adepeju A, Gbadamosi SO, Adeniran AH, Omobuwajo TO. Functional and pasting characteristics of breadfruit (Artocarpus altilis) flours. Afr J Food Sci 2011;5:529-35.
- Yafang S, Gan Z, Jinsong B. Total phenolic content and antioxidant capacity of rice grains with extremely small size. Afr J Agric Res 2011;6:2289-93.
- Pal V, Pandey JP, Sah PC. Effect of degree of polish on proximate composition of milled rice. J Food Sci Technol 1999;36:160-2.
- Eggum BO, Juliano BO, Maningat CC. Protein and energy utilization of rice milling fractions by rats. Plant Foods Hum Nutr 1982;31:371-6.
- Grist DH. Rice. 4th ed, 1985. London: Longamans; 1965.
- Hirokadzu T, Harue T, Keishi F. Influence of cropping season on lipid content and fatty acid composition of lowland non-glutinous brown rice. Jpn J Crop Sci 1979;48:371-7.
- Ahmed SA, Borua I, Das D. Chemical composition of scented rice. Oryza 1998;35:167-9.
- Mbatchou VC, Dawda S. The nutritional composition of four rice varieties grown and used in different food preparations in Kassena-Nankana district, Ghana. Int J Res Chem Environ 2013;3:308-15.
- Gunaratne A, Bentota A, Cai YZ, Collado L, Corke H. Functional, digestibility, and antioxidant properties of brown and polished rice flour from traditional and new-improved varieties grown in Sri Lanka. Starch-Starke 2011;63:485-92.
- Asimah VK, Adzinyo OA, Dzah CS. Utilization of brown rice flour and peanut paste in cake production. Am J Food Sci Technol 2016;4:129-34.
- Yeager S. Fiber-the Ultimate Healer. The Doctors Book of Food Remedies. Emmaus, Pennsylvania: Rodale Press, Inc.; 1998. p. 184-5.
- World Health Organization. Obesity: Preventing and Managing the Global Epidemic (No. 894). Geneva: World Health Organization; 2000.
- Eastwood MA. Dietary fibre in human nutrition. J Sci Food Agric 1974;25:1523-7.
- Scott VE. Stability of Whole Wheat Flour, Rolled Oats, and Brown Rice During Long-Term Storage and Preparation. Msc Thesis Report, Brigham Young University; 2015.
- Kinsella JE, Melachouris N. Functional properties of proteins in foods: A survey. Crit Rev Food Sci Nutr 1976;7:219-80.
- Singh A, Sharma S, Singh B. Influence of grain activation conditions on functional characteristics of brown rice flour. Food Sci Technol Int 2017;23:500-12.
- Fagbemi TN. Effect of blanching and ripening on functional properties of plantain (Musa aab) flour. Plant Foods Hum Nutr 1999;54:261-9.
- Berggren S. Water Holding Capacity and Viscosity of Ingredients from Oats: The Effect of b-glucan and Starch Content, Particle Size, pH and Temperature. Bachelor Thesis Project in Chemistry, Linneuniversitetet; 2018.
- Nikolic N, Dodi J, Mitrovic M, Lazic M. Rheological properties and the energetic value of wheat flour substituted by different shares of white and brown rice flour. Chem Industry Chem Eng Q CICEQ 2011;17:349-57.
- Chinma CE, Anuonye JC, Simon OC, Ohiare RO, Danbaba N. Effect of germination on the physicochemical and antioxidant characteristics of rice flour from three rice varieties from Nigeria. Food Chem 2015;185:454-8.
- Ostermann-Porcel MV, Quiroga-Panelo N, Rinaldoni AN, Campderros ME. Incorporation of Okara into gluten-free cookies with high quality and nutritional value. Journal of Food Quality 2017(23):1-8
- Varavinit S, Shobsngob S. Comparative properties of cakes prepared from rice flour and wheat flour. Eur Food Res Technol 2000;211:117-20.
- Dogan IS. Effect of oven types on the characteristics of biscuits made from refrigerated and frozen doughs. Food Technol Biotechnol 2006;44:117-22.
- Adeleke RO, Odedeji JO. Functional properties of wheat and sweet potato flour blends. Pak J Nutr 2010;9:535-8.
- Santos CT, Bonomo RF, Fontan RD, Bonomo P, Velo CM, Fontan GC. Characterization and sensorial evaluation of cereal bars with jackfruit. Acta Sci Technol 2011;33:81-5.
- Oloyede OI. Chemical profile of unripe pulp of Carica papaya. Pak J Nutr 2005;4:379-81.
- Zamora-Gasga VM, Bello-Perez LA, Ortiz-Basurto RI, Tovar J, Sayago-Ayerdi SG. Granola bars prepared with Agave tequilana ingredients: Chemical composition and in vitro starch hydrolysis. LWT Food Sci Technol 2014;56:309-14.
- Grden L, Oliveira CS, Bortolozo EA. Preparation of a cereal bar as rewarding food for athletes and practitioners of physical activity. Braz J Agrotechnol Ind 2008;2:87-94.
- Baljeet SY, Ritika BY, Roshan L. Studies on functional properties and incorporation of buckwheat flour for biscuit making. Int Food Res J 2010;17:1067-76.
- Adams SP. Mechanisms of Nutrition Bar Hardening: Effect of Hydrolyzed whey Protein and Carbohydrate Source. Msc Thesis Project, Utah State University; 2008.
- Agbaje R, Hassan CZ, Norlelawati A, Rahman AA, Huda-Faujan N. Development and physico-chemical analysis of granola formulated with puffed glutinous rice and selected dried Sunnah foods. Int Food Res J 2015;23:498-506.
- Choi I, Han OK, Chun J, Kang CS, Kim KH, Kim YK, et al. Hydration and pasting properties of oat (Avena sativa) flour. Prev Nutr Food Sci 2012;17:87-91.
- Wu G. Dietary protein intake and human health. Food Funct 2016;7:1251-65.
- Cecchi HM. Theoretical Foundations and Practical Analysis of Food. 2nd ed. Campinas: Unicamp; 2003.
- Reader DM, O'Connell BS, Johnson ML, Franz M. Glycemic and insulinemic response of subjects with type 2 diabetes after consumption of three energy bars. J Am Diet Assoc 2002;102:1139-42.
- Anderson JW, Baird P, Davis RH Jr., Ferreri S, Knudtson M, Koraym A, et al. Health benefits of dietary fiber. Nutr Rev 2009;67:188-205.
- de Carvalho MG, da Costa JM, de Souza VA, Maia GA. Evaluation of some physical and nutritional parameters of almonds of chicha, Sapucaia and castanha-do-gurgueia. Rev Ciencia Agronomica 2008;39:517.
- Hodzic Z, Pasalic H, Memisevic A, Srabovic M, Saletovic M, Poljakovic M. The influence of total phenols content on antioxidant capacity in the whole grain extracts. Eur J Sci Res 2009;28:471-7.
- Van Hung P. Phenolic compounds of cereals and their antioxidant capacity. Crit Rev Food Sci Nutr 2016;56:25-35.
- Daniel O, Meier MS, Schlatter J, Frischknecht P. Selected phenolic compounds in cultivated plants: Ecologic functions, health implications, and modulation by pesticides. Environ Health Perspect 1999;107 Suppl 1:109-14.
- Martinez-Valverde I, Periago MJ, Ros G. Significado nutricional de los compuestos fenolicos de la dieta. Arch Latinoam Nutr 2000;50:5-18.
- Newmark HL. Plant phenolics as potential cancer prevention agents. Adv Exp Med Biol 1996;401:25-34.
- Civille GV, Carr BT. Sensory Evaluation Techniques. Boca Raton, FL: CRC Press; 2015.