The Low Level of Fat-Free-Mass is a Risk Factor for Cognitive Impairment among Morocco's Older Adults
Abdeljalil Talhaoui, Youssef Aboussaleh, Ahmed O. T. Ahami, Rachid Sbaibi, Naima Agoutim
Citation : Talhaoui A, Aboussaleh Y, Ahami AOT, Sbaibi R, Agoutim N. The Low Level of Fat-Free-Mass is a Risk Factor for Cognitive Impairment among Morocco's Older Adults. Clin J Nutr Diet 2018;1(2):1-7.
The aim of this study was to determine the relationship between body composition and risk of cognitive impairment
among Morocco older adults.
A sample of 237 older adults aged above 60 years were recruited from three nursing homes belong to three different cities Rabat, Kenitra, and Sidi Kacem city and from one health center in Sidi Kacem city. From them, 151 subjects (59.6% men and 40.4% women) were included in our study for their complete data. Sociodemographic characteristics and health condition were collected using a general questionnaire. Body compositions evaluation using bioelectrical impedance analysis accompanied with a measure of body mass index, calf circumference, mid-upper arm circumference, waist circumference, and waist-to-hip ratio. Cognitive functions were assessed by the Mini-Mental State Examination. Nutritional status, depression, and physical activity (PA) were assessed using, respectively: Mini nutritional assessment, geriatric depression scale-15, and global PA questionnaire which were taking as confounder factors.
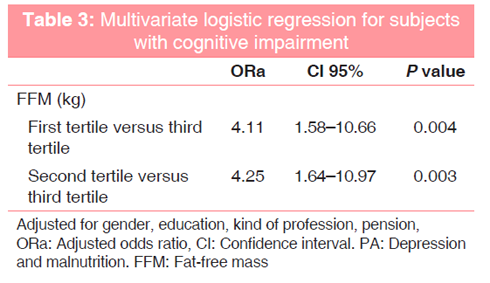
The multivariate logistic regression adjusted for gender, education, kind of profession, pension, PA, depression, and malnutrition shows that only the first tertile (adjusted odds ratio [ORa] = 4.11, 95% CI: 1.58-10.66) and second tertile (ORa = 4.25, 95% CI: 1.64-10.97) of fat-free mass (FFM) compared to the third tertile, were found to be risk factors for cognitive impairment.
The present study demonstrated that lower level of FFM was associated with a higher risk of cognitive impairment among the elderly. This indicates that the preservation of muscle mass by good nutrition and PA could save cognitive function from the onset of Alzheimer's disease.
Body composition, body mass index, cognitive function, older adults
INTRODUCTION
Aging is characterized by physiological and psychological changes induced by genetic factors called intrinsic factors and environmental factors called extrinsic, on which various pathologies are added to accelerate the aging process [1]. The last two factors (extrinsic and pathological) represent the most modifiable target we can act on to slow down the effects of aging and preserve the maximum independence of the elderly. Aging is characterized by body composition changes, with an increasing of adiposity (fat mass [FM]) (sarcopenic obesity) and decreasing of fat-free mass (FFM) (sarcopenia), which has a negative impact on health outcomes and quality of life [2,3]. The quantification of these two parameters FM and FFM among elderly is important to describe their changes associated with the functional decline, diseases, and survival [2].
It is confirmed that aging is associated with the progression of cognitive decline, which could be convert in a 8.3% of cases to Alzheimer's disease (AD) per years [4,5]. Alzheimer's (AD) is a neurodegenerative disease that characterized by memory lost, cognitive and behavioral disorders with repercussions on the daily life of patient [6]. Memory deficit or mild cognitive impairment (MCI) is one of the earliest and most pronounced symptoms of AD [7]. At this stage the population may constitute, a particularly suitable population for preventive approaches, and clinical trials of drug therapies[5]. By 2050 cognitive impairment including MCI is expected to affect 115 million people in the world [8]. The Mini-Mental State Examination (MMSE) represents the most used tool in world elaborated by on Anthony et al. on 1975 to assess global cognitive impairment with specificity and sensitivity 82% and 87%, respectively [9]. The MMSE is a brief test that takes a few minutes in its execution. It is composed of a series of questions grouped into seven subtests. The questions relate to: Orientation in time, orientation in space, immediate recall of three words, attention, delayed recall of three words, language, and constructive praxis [10].
The aim of this study was the identification the link between body compositions and cognitive impairment (CI) among the elderly living in three cities (Rabat, Kenitra, and Sidi Kacem city) in north out of Morocco.
MATERIALS AND METHODS
In this cross-sectional study which was conducted between March 2017 and May 2018, all participants were recruited from three nursing homes belong to three different cities, Rabat, Kenitra, and Sidi Kacem city and from one health center in Sidi Kacem city. The three cities are located in north out of Morocco. The four exclusion criteria were: (1) Persons cannot stand up for body composition measurement, (2) age < 60 years, (3) subjects with renal insufficiency which could confounder and overestimate the body mass index, and (4) persons with acute pain that could influence their performance on MMSE test. At beginning 237 subjects were recruited for this study, but after excluding 56 subjects for MMSE, 5 subjects for mini nutritional assessment (MNA), 20 subjects for body compositions, and 5 subjects for physical activity (PA) missing data, 151 subjects were included in our study for their complete data.
Demographic data and medical conditions were obtained from social and medical assistance in nursing homes and by direct interview with patients visiting a health center in Sidi Kacem city. Oral consent was obtained from each participant before be including in this study.
Nutritional status of our sample was evaluated by MNA, tool developed by Guigoz et al. and recommended by the European Society for Clinical Nutrition and Metabolism [11,12]. It is composed of 18 items grouped in four sections: Anthropometric assessment (weight, height, and weight loss), general assessment (living situation, number of medicine use, and mobility), dietary assessment (number of meals, food and fluid intake, and autonomy of feeding), and subjective assessment (self-perception of nutritional status and health) [13]. A total score ranges from 24 to 30 reflects good nutritional status. Score between 17 and 23, 5 indicates a risk of malnutrition. MNA score < 17 points indicates malnutrition [14].
The participants were referred to body compositions evaluation using bioelectrical impedance analysis (BIA) (Rossmax, Glass Body Fat Monitor with Scale, model: WF 260, Swiss). The noninvasive, simple applicable, safe, inexpensive, and low collaboration requirement from patients of the BIA make it widely used for the study of body composition [2,15]. The limitation of this tool is give the FM in whole body and not in special part of body for this reason another parameter was measured in our study is waist circumference (WC) that is used as an indicator of body fatness and abdominal body fat [16]. The participants were asking to stand up, on the exhale, a flexible nonelastic tape measure across the belly button between the lower rib margin and the iliac crest at the nearest 0.5 cm the WC. FFM was measured by subtracted the FM from total body weight.
Cognitive function was assessed with the MMSE. With a cutoff of 24, the elderly was classified into two categories: Normal or cognitive impairment.
The geriatric depression scale-15 was used to evaluate the depressive syndrome among elderly participants, with score maximal of 15 points. A score between 5 and 12 was used to indicate slight depression and score >12 for severe depression [17].
The global PA questionnaire is one of the validated questionnaire developed by the WHO to assesses PA in developing countries [18]. The questionnaire composed of 16 items, collecting information about vigorous and moderate intensity PA, covering three domains: Working (paid or unpaid), commuting (walking or cycling), and leisure times [19]. According to the norms recommended by the WHO for this tool, the participants' were classified into three levels:
- If the person practices vigorous intensity PA on at least 3 days with an expending of 1500 MET-minutes a minimum per week or
- If the person practices seven or more days of walking, moderate- or vigorous-intensity activities with an expending a minimum of 3000 MET-minutes per week.
- If the subject practices at least 20 min/day of vigorous-intensity activity 3 or more times per week or
- At least 30 min/day of moderate-intensity activity or walking 5 or more times per week or
- 5 or more days of walking, moderate - or vigorous-intensity activities expending a minimum of 600 MET-minutes per week.
The subject considered as having low level of PA if he does not meet any of the above criteria.
Statistical analysis was performed using software SPSS version 24. Student's t-test was used for comparison of quantitative variables between two groups, for those follow a normal distribution, Mann-Whitney U-tests for those have no normal distribution. The Chi-square test was used to analyze the association between categorical variables. Pearson and Spearman tests for correlation between two quantitative variables have a normal and not normal distribution, respectively. After that, a binary logistic regression was applied, where cognitive function was taking as the dependent variable and body composition parameters as independent variables. Those baseline characteristics showing an association with cognitive function in bivariate analysis were taking as confounder factors. The adequacy of the logistic regression was checked using Hosmer-Lemeshow test. P < 0.05 was considered significant for all analysis.
RESULTS
Our results show that Table 1, cognitive impairment was more frequent among women than men in our sample (P = 0.01). The subjects with cognitive impairment were more likely to have low education (P < 0.001), to never practiced some profession (P = 0.017), without pension (P = 0.013), and to have less physical activities (P = 0.026). The depression (P = 0.039) and malnutrition (P = 0.006), both were more frequent among subjects with CI than subjects.
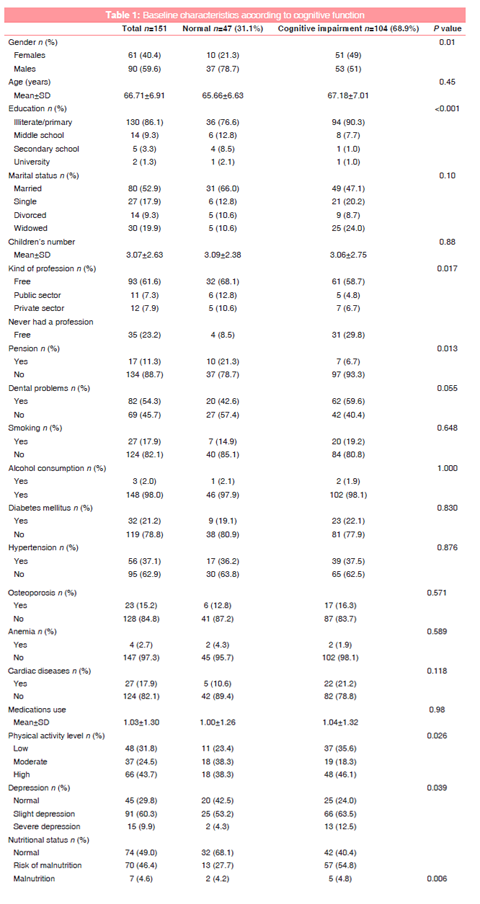
Table 2 shows body composition distributions according to cognitive function. Person's with cognitive impairment tend to have less FFM (P < 0.001), and less calf circumference (CC) (P = 0.01). No statistically difference was found for all other parameters between cognitive impaired and normal subjects (P > 0.05).
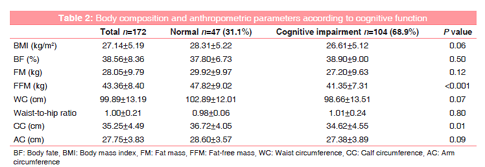
Table 3 shows the multivariate logistic regression adjusted for gender, education, kind of profession, pension, PA, depression, and malnutrition shows that only the first tertile (adjusted odds ratio [ORa] = 4.11, 95% CI: 1.58-10.66) and second tertile (ORa = 4.25, 95% CI: 1.64-10.97) of FFM compared to the third tertile, were found to be risk factors for cognitive impairment.
DISCUSSION
In lack of its cure or agreed prevention, cognitive impairment (CI) continued to increase in our aging societies and has been previously associated with comorbidity, mortality, and risk of dementia [20-22]. Body composition parameters could be modifiable risk factors for cognitive impairment progression to dementia. This study investigated the relationship between body composition and CI. Our findings suggested that cognitive impairment was associated only with FFM. The studies finding are less controversial for FFM than FM in term of relationship with CI. From a positive association, negative to no association between FM and cognitive decline [23-29]. While from seven studies found in literature six have demonstrated that FFM was associated with cognitive function and only one showed, no association between changes in body composition and cognitive dysfunction, with arm muscular mass was taking instead of FFF in last study [23-31]. Moreover, Bas et al.[32] in their study among 840 participants with MCI and 1740 without MCI. After adjusting for confounding factors, the lowest quartile of FFM was associated with a higher risk of MCI. However, FM was not associated with risk of MCI in this study. We did not find any association between WC, Waist-to-hip ratio, BMI, and arm circumference with CI this finding contradict those reported in other previous studies [33-40]. In study conducted by Ashrafi et al.[41] among 118 consecutive patients with different cardiovascular and metabolic primary complaints, none of the cognitive domains had a significant association with BMI. The relationship between waist-to-hip ratio and cognitive function was attenuated with adjustment for cardiovascular disease risk factors and PA in study realized by Dore et al.[42]. In a cross-sectional analysis performed on the 1st-year baseline data of 1559 adults aged 70-84 years enrolled in the Korean, low calf circumference (< 32 cm) was much greater in the prefrail with cognitive impairment [43]. In our finding, CC was significantly associated with CI. However, in multivariate analysis, this association did not rich the signification.
Our finding suggested that the subjects with low FFM have a higher risk of CI. This association could be explained by the fact that low level of muscle mass (MM) and CI shares common mechanisms such as oxidative stress and inflammation [44]. The elevation in mediators of inflammation such as interleukin-1, interleukin-6, and tumor necrosis factor in response to stress situation, chronic or acute disease cause a muscular mass catabolism. Those mediators were found in many studies to be associated with cognitive decline [45-48]. Moreover, previous studies suggested that loss of MM might be related to brain atrophy and cognitive decline [49]. The preservation of MM during stress periods depend to food intake, and malnutrition was linked to cognitive impairment in many studies El Zoghbi et al [50]. and Hai et al.[51] Other parameter should be taking into account in the relationship between FFM and CI is PA which seems to contribute to protection against muscle wasting [52]. Lochbaum et al.[53] have demonstrated that aerobically trained or active participants performed significantly better on the fluid intelligence task than aerobically untrained or inactive. In our finding, both nutritional status and PA were associated with CI (P < 0.005) and were taking as confounder factors in multivariate analysis.
This study has some limitations. It's kind of cross-sectional make the cause and effect between body composition and cognitive impairment cannot be established. Moreover, the association between the last two parameters was not analyzed according to gender cause of our small simple size. Further longitudinal studies among large simple size are needed to confirm our finding.
CONCLUSIONS
The present study demonstrated that lower level of FFM was associated with a higher risk of cognitive impairment among elderly. This indicates that the preservation of MM by good nutrition and PA could save cognitive function from the onset of AD.
REFERENCES
- Jaeger C, Cherin P. The theories of aging. Med Longev 2011; 3: 155-1.
- Dey DK, Bosaeus I. Comparison of bioelectrical impedance prediction equations for fat-free mass in a population-based sample of 75 y olds: The NORA study. Nutrition 2003;19:858-64.
- Roubenoff R. Origins and clinical relevance of sarcopenia. Can J Appl Physiol 2001;26:78-89.
- Laursen P. The impact of aging on cognitive functions. An 11 year follow-up study of four age cohorts. Acta Neurol Scand Suppl 1997;172:7-86.
- Larrieu S, Letenneur L, Orgogozo JM, Fabrigoule C, Amieva H, Le Carret N, et al. Incidence and outcome of mild cognitive impairment in a population-based prospective cohort. Neurology 2002;59:1594-9.
- El Kadmiri N, Hamzi K, El Moutawakil B, Slassi I, Nadifi S. The genetic aspects of Alzheimer's disease (Review). Pathol Biol 2013; 61: 228-38.
- Spaccavento S, Del Prete M, Craca A, Fiore P. Influence of nutritional status on cognitive, functional and neuropsychiatric deficits in Alzheimer's disease. Arch Gerontol Geriatr 2009;48:356-60.
- Solfrizzi V, Panza F, Frisardi V, Seripa D, Logroscino G, Imbimbo BP, et al. Diet and Alzheimer's disease risk factors or prevention: The current evidence. Expert Rev Neurother 2011;11:677-708.
- Anthony JC, LeResche L, Niaz U, von Korff MR, Folstein MF. Limits of the 'mini-mental state' as a screening test for dementia and delirium among hospital patients. Psychol Med 1982;12:397-408.
- Derouesne C, Poitreneau J, Hugonot L, Kalafat M, Dubois B, Laurent B. The Mini-Mental State Examination (MMSE): A practical tool for assessing the cognitive state of patients by the clinician. Press Med 1999; 28: 1141-8.
- Guigoz Y, Vellas B, Garry PJ. Assessing the nutritional status of the elderly: The mini nutritional assessment as part of the geriatric evaluation. Nutr Rev 1996;54:S59-65.
- Kondrup J, Allison SP, Elia M, Vellas B, Plauth M, Educational and Clinical Practice Committee, European Society of Parenteral and Enteral Nutrition (ESPEN), et al. ESPEN guidelines for nutrition screening 2002. Clin Nutr 2003;22:415-21.
- van Bokhorst-de van der Schueren MA, Lonterman-Monasch S, de Vries OJ, Danner SA, Kramer MH, Muller M, et al. Prevalence and determinants for malnutrition in geriatric outpatients. Clin Nutr 2013;32:1007-11.
- Guigoz Y, Vellas B, Garry P. Facts, research and intervention in gerontology. In: The Mini Nutritional Assessment: A Practical Assessment Tool for Grading the Nutritional State of Elderly Persons. 3rd ed. Paris: Serdi Publishing Company; 1997. p. 15-60.
- Lukaski HC, Johnson PE, Bolonchuk WW, Lykken GI. Assessment of fat-free mass using bioelectrical impedance measurements of the human body. Am J Clin Nutr 1985;41:810-7.
- Snijder MB, van Dam RM, Visser M, Seidell JC. What aspects of body fat are particularly hazardous and how do we measure them? Int J Epidemiol 2006;35:83-92.
- Kurkcu M, Meijer RI, Lonterman S, Muller M, de van der Schueren MA. The association between nutritional status and frailty characteristics among geriatric outpatients. Clin Nutr ESPEN 2018;23:112-6.
- Armstrong T, Bull F. Development of the world health organization global physical activity questionnaire (GPAQ). J Public Health 2006;14:66-70.
- Hamrik Z, Sigmundova D, Kalman M, Pavelka J, Sigmund E. Physical activity and sedentary behaviour in Czech adults: Results from the GPAQ study. Eur J Sport Sci 2014;14:193-8.
- DaviglusML,BellCC,BerrettiniW,BowenPE,Connolly ES Jr., Cox NJ, et al. NIH state-of-the-science conference statement: Preventing Alzheimer's disease and cognitive decline. NIH Consens State Sci Statements 2010;27:1-30.
- Alzheimer's Association. Alzheimer's disease facts and figures. Alzheimer's dementia. J Alzheimers Assoc 2011;2011:1-68.
- Barnes DE, Yaffe K, Satariano WA, Tager IB. A longitudinal study of cardiorespiratory fitness and cognitive function in healthy older adults. J Am Geriatr Soc 2003;51:459-65.
- Roh J, Kim H, Lee K. Relationship between body composition and cognitive function: Using bioelectrical impedance analysis. J Korean Geriatr Psychiatry 2018;22:1-6.
- Papachristou E, Ramsay SE, Lennon LT, Papacosta O, Iliffe S, Whincup PH, et al. The relationships between body composition characteristics and cognitive functioning in a population-based sample of older British men. BMC Geriatr 2015;15:172.
- Kanaya AM, Lindquist K, Harris TB, Launer L, Rosano C, Satterfield S, et al. Total and regional adiposity and cognitive change in older adults: The health, aging and body composition (ABC) study. Arch Neurol 2009;66:329-35.
- Nourhashemi F, Andrieu S, Gillette-Guyonnet S, Reynish E, Albarede JL, Grandjean H, et al. Is there a relationship between fat-free soft tissue mass and low cognitive function? Results from a study of 7,105 women. J Am Geriatr Soc 2002;50:1796-801.
- Luchsinger JA, Biggs ML, Kizer JR, Barzilay J, Fitzpatrick A, Newman A, et al. Adiposity and cognitive decline in the cardiovascularhealthstudy.Neuroepidemiology2013;40:274-81.
- Willers J, Hahn A, Kobe T, Gellert S, Witte V, Tesky V, et al. Poor body composition in patients with mild cognitive impairment compared to healthy older controls. J Aging Res Clin Pract 2018;7:37-41.
- Farooq A, Gibson AM, Reilly J, Gaoua N. The association between obesity and cognitive function in otherwise healthy premenopausal Arab women. J Obes 2018;2018:1-7.
- Noh HM, Oh S, Song HJ, Lee EY, Jeong JY, Ryu OH, et al. Relationships between cognitive function and body composition among community-dwelling older adults: A cross-sectional study. BMC Geriatr 2017;17:259.
- van Kan GA, Cesari M, Gillette-Guyonnet S, Dupuy C, Vellas B, Rolland Y, et al. Association of a 7-year percent change in fat mass and muscle mass with subsequent cognitive dysfunction: The EPIDOS-toulouse cohort. J Cachexia Sarcopenia Muscle 2013;4:225-9.
- Bae S, Shimada H, Park H, Lee S, Makizako H, Doi T, et al. Association between body composition parameters and risk of mild cognitive impairment in older Japanese adults. Geriatr Gerontol Int 2017;17:2053-9.
- Zhou Y, Flaherty JH, Huang CQ, Lu ZC, Dong BR. Association between body mass index and cognitive function among Chinese nonagenarians/centenarians. Dement Geriatr Cogn Disord 2010;30:517-24.
- Rodriguez-Fernandez JM, Danies E, Martinez-Ortega J, Chen WC. Cognitive decline, body mass index, and waist circumference in community-dwelling elderly participants. J Geriatr Psychiatry Neurol 2017;30:67-76.
- Kim S, Kim Y, Park SM. Body mass index and decline of cognitive function. PLoS One 2016;11:e0148908.
- Kim HJ, Oh ES, Lee JH, Moon JS, Oh JE, Shin JW, et al. Relationship between changes of body mass index (BMI) and cognitive decline in Parkinson's disease (PD). Arch Gerontol Geriatr 2012;55:70-2.
- Estrella-Castillo DF, Alvarez-Nemegyei J, Gomez-de-Regil L. Association between body mass index with cognitive or physical functioning, and depression in Mexican elderly: A cross-sectional study. Neuropsychiatry 2016;6:271-9.
- Cronk BB, Johnson DK, Burns JM, Alzheimer's Disease Neuroimaging Initiative. Body mass index and cognitive decline in mild cognitive impairment. Alzheimer Dis Assoc Disord 2010;24:126-30.
- Kerwin DR, Zhang Y, Kotchen JM, Espeland MA, Van Horn L, McTigue KM, et al. The cross-sectional relationship between body mass index, waist-hip ratio, and cognitive performance in postmenopausal women enrolled in the women's health initiative. J Am Geriatr Soc 2010;58:1427-32.
- Won H, Abdul Manaf Z, Mat Ludin AF, Shahar S. Wide range of body composition measures are associated with cognitive function in community-dwelling older adults. Geriatr Gerontol Int 2017;17:554-60.
- Ashrafi F, Ahmadi MA, Behnam B, Shashaani L, Zarghi A. Association between body mass index and cognitive performance. Int Clin Neurosci J 2015;2:4.
- Dore GA, Elias MF, Robbins MA, Budge MM, Elias PK. Relation between central adiposity and cognitive function in the maine-syracuse study: Attenuation by physical activity. Ann Behav Med 2008;35:341-50.
- Kim M, Jeong MJ, Yoo J, Song DY, Won CW. Calf circumference as a screening tool for cognitive frailty in community-dwelling older adults: The Korean frailty and aging cohort study (KFACS). J Clin Med 2018;7:332.
- Roubenoff R, Roubenoff RA, Cannon JG, Kehayias JJ, Zhuang H, Dawson-Hughes B, et al. Rheumatoid cachexia: Cytokine-driven hypermetabolism accompanying reduced body cell mass in chronic inflammation. J Clin Invest 1994;93:2379-86.
- Windham BG, Simpson BN, Lirette S, Bridges J, Bielak L, Peyser PA, et al. Associations between inflammation and cognitive function in African Americans and European Americans. J Am Geriatr Soc 2014;62:2303-10.
- Williams AM, Shah R, Shayne M, Huston AJ, Krebs M, Murray N, et al. Associations between inflammatory markers and cognitive function in breast cancer patients receiving chemotherapy. J Neuroimmunol 2018;314:17-23.
- Marioni RE, Strachan MW, Reynolds RM, Lowe GD, Mitchell RJ, Fowkes FG, et al. Association between raised inflammatory markers and cognitive decline in elderly people with Type 2 diabetes: The Edinburgh Type 2 diabetes study. Diabetes 2010;59:710-3.
- Kurella Tamura M, Tam K, Vittinghoff E, Raj D, Sozio SM, Rosas SE, et al. Inflammatory markers and risk for cognitive decline in chronic kidney disease: The CRIC study. Kidney Int Rep 2017;2:192-200.
- Hsu YH, Liang CK, Chou MY, Liao MC, Lin YT, Chen LK, et al. Association of cognitive impairment, depressive symptoms and sarcopenia among healthy older men in the veterans retirement community in Southern Taiwan: A cross-sectional study. Geriatr Gerontol Int 2014;14 Suppl 1:102-8.
- El Zoghbi M, Boulos C, Amal AH, Saleh N, Awada S, Rachidi S, et al. Association between cognitive function and nutritional status in elderly: A cross-sectional study in three institutions of Beirut-Lebanon. Geriatr Ment Health Care 2013;1:73-81.
- Hai S, Cao L, Yang X, Wang H, Liu P, Hao Q, et al. Association between nutrition status and cognitive impairment among Chinese nonagenarians and centenarians. Int J Gerontol 2017;11:215-9.
- Mijnarends DM, Koster A, Schols JM, Meijers JM, Halfens RJ, Gudnason V, et al. Physical activity and incidence of sarcopenia: The population-based AGES-reykjavik study. Age Ageing 2016;45:614-20.
- Lochbaum MR, Karoly P, Landers DM. Evidence for the importance of openness to experience on performance of a fluid intelligence task by physically active and inactive participants. Res Q Exerc Sport 2002;73:437-44.