Use of Control Charts as a Quality Control Tool for Monitoring of
Microbiological Infection Risk during Surgery: An Expository Case
Essam Eissa Mostafa
Citation :Mostafa EE. Use of Control Charts as a Quality Control Tool for Monitoring of Microbiological Infection Risk during Surgery: An Expository Case. Clin J Surg 2019;2(1):1-3.
Dear Editor
Prevention of microbiological infection of a surgical wound is an important quality attribute that should be monitored regularly to ensure compliance with good operation practices [4]. Shewhart charts provide an indispensable tool to assess the surgical site infection (SSI) state, deliver early warning for any deviations from the existing process, and give measurable mean for evaluation of any change and improvement made in the surgery processing operations [5]. Several types of researches have been conducted to apply control charts for monitoring SSI in different studies. Trending charts that were used include p-chart, cumulative sum, and exponentially weighted moving average [6-10].
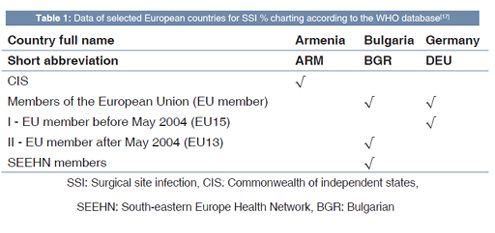
Control charts have been used in various situations in different industries and services notably health care and pharmaceutical fields [11-14]. The present case demonstrated the use of conventional or Laney modified u-chart after diagnosis check for data spreading to avoid elevated false alarm rate using Minitab® 17.1.0 as demonstrated earlier in other research works [15,16]. The WHO data of SSI rates on yearly basis were selected from three different countries that fall within the WHO European region (WHO EURO). These chosen countries with its WHO data are listed in Table 1 [17]. Constructed trending charts data were based secondarily on European Health for All database (HFA-DB) for Figures 1-3 [17] only. Figure 3 was made using the classical type of attribute chart as data dispersion has passed the diagnostic test. Red dots in the control charts represent years of unusual rates of SSI, where warning points in the upper side (above the green line) represent high-risk periods.
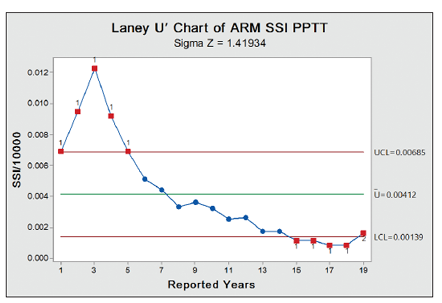
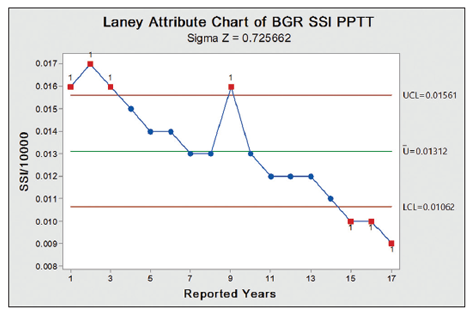
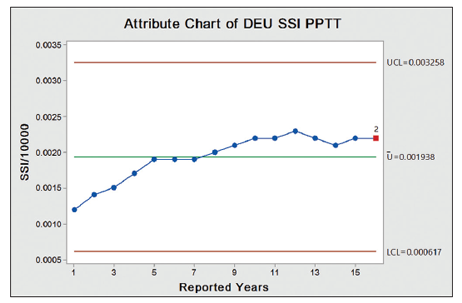
While red points of the lower side show opportunities for improvements. SSI % in Bulgaria was the highest with initial abnormal values followed by gradual falling in the rate interrupted by a freakish rise in 1 year with SSI rate range of about 0.8%. Armenian SSI % is relatively lower than the previous one with a somewhat similar pattern, but steeper declines with no interrupting rise SSI rate and range of approximately 1.2%. German SSI trend was the most stable one although it slightly tends to increase with time due to shift in SSI % mean. With the exception of the last 6 years of the Armenian SSI %, German SSI trend is the lowest with a range of about 0.1%. Accordingly, the control limit range of the three countries is 0.50%, 0.55%, and 0.26%, respectively.
CONCLUSION
Implementation of statistical process control (SPC) in the health-care industry generally and hospitals specifically is crucial as quality control monitoring tool of SSI to ensure patient safety and health. Medical staff should be aware of using SPC and regular trending must be assigned for those who are well trained in statistics and control charts to ensure on-time review and control of the process. Thus, any excursion could be spotted, investigated, and contained in a timely manner. The use of statistical software programs facilitates the process of online visualization of the current states of SSI to facilitate the establishment of correction(s) before any true out-of-control cases emerge. Further, improvement is required in controlling of SSI cases, especially in two European countries in this case - although general trend line is decreasing - and a retrending will be necessary to measure the degree of stability and enhancement achieved, in addition to allocating assignable causes of variability quantitatively to correct and isolate them from common causes of process variations.
REFERENCES
- World Health Organization. Practical Guidelines for Infection Control in Health Care Facilities. Manila: World Health Organization; 2004.
- National Institute for Health and Clinical Excellence. Infection, Surgical Site. Prevention and Treatment of Surgical Site Infection [NICE Clinical Guideline 74]. London, England: National Institute for Health and Clinical Excellence; 2008.
- Reichman DE, Greenberg JA. Reducing surgical site infections: A review. Rev Obstet Gynecol 2009;2:212-21.
- Tsai DM, Caterson EJ. Current preventive measures for health-care associated surgical site infections: A review. Patient Saf Surg 2014;8:42.
- Sellers MM, Reinke CE, Kreider S, Meise C, Nelis K, Volpe A, et al. American college of surgeons NSQIP: Quality in-training initiative pilot study. J Am Coll Surg 2013;217:827-32.
- Gustafson TL. Benchmarks and control charts for surgical site infections. Br J Surg 2000;87:952-3.
- Morton AP, Whitby M, McLaws ML, Dobson A, McElwain S, Looke D, et al. The application of statistical process control charts to the detection and monitoring of hospital-acquired infections. J Qual Clin Pract 2001;21:112-7.
- Raghunathan K, Al-Najjar H, Snavely A. Control charts and control limits. Anesth Analg 2011;112:736-7.
- Cima R, Dankbar E, Lovely J, Pendlimari R, Aronhalt K, Nehring S, et al. Colorectal surgery surgical site infection reduction program: A national surgical quality improvement program - driven multidisciplinary single-institution experience. J Am Coll Surg 2013;216:23-33.
- Baker AW, Haridy S, Salem J, Ilies I, Ergai AO, Samareh A, et al. Performance of statistical process control methods for regional surgical site infection surveillance: A 10-year multicentre pilot study. BMJ Qual Saf 2018;27:600-10.
- Eissa M, Mohsen AA. Evaluation of quality characteristics and process stability for pharmaceutical dosage form using attribute control charts. Int J Adv Med Sci 2016;1:9-15.
- Eissa ME. Application of control charts in quality characteristics evaluation of microbiological media. J Adv Res Pharm Sci Pharmacol Interv 2017;1:1-13.
- Eissa ME. Application of Laney control chart in assessment of microbiological quality of oral pharmaceutical filterable products. Bangladesh J Sci Ind Res 2017;52:239-46.
- Eissa ME. Determination of the microbiological quality of feed city water to pharmaceutical facility: Distribution study and statistical analysis. Athens J Sci 2017;4:143-60.
- Eissa M. Microbiological purified water trend using two types of control chart. Eur Pharm Rev 2018;23:36-8.
- Eissa ME. Microbiological quality of purified water assessment using two different trending approaches: A case study. Sumerianz J Sci Res 2018;1:75-9.
- World Health Organization. WHO European Health Information at Your Fingertips; 2018. Available from: https:// www.gateway.euro.who.int/en/datasets/european-health-for-all-database/. [Last accessed on 2018 Dec 16].