Precision of Repeated Peripheral and Visceral Adipose Tissue Quantification using GE Lunar Dual-Energy X-ray Absorptiometry in Healthy, Non-athletic Adult Women
Adam Wysokinski
Citation : Wysokinski A. Precision of Repeated Peripheral and Visceral Adipose Tissue Quantification using GE Lunar Dual-Energy X-ray Absorptiometry in Healthy, Non-athletic Adult Women. Clin Res Diabetes Endocrinol 2018;1(2):1-7.
We determined the precision of peripheral and visceral adipose tissue (VAT) quantification using dual-energy X-ray absorptiometry (DXA) in two consecutive measurements. Furthermore, we tested if body mass index (BMI) may affect the precision of body fat quantification in repeated measurements. A total of 139 non-athletic, adult (age =18 years) European Caucasian women were included in the study. Body composition was measured using GE Healthcare Lunar iDXA densitometer. All DXA measurements were performed 2 times, by the same technician, with up to 10 min of interval and with repositioning between scans. %CV for VAT was 19.7%. For peripheral adipose tissue, it ranged from 5.8% to 0.76%, depending on region analyzed. Lower %CV values were found for larger regions. With higher BMI precision of repeated measurements was also higher. For most clinical applications, precision of repeated DXA body composition measurements of peripheral adipose tissue may be sufficient. For VAT measurements, its precision is lower, and therefore, it may limit its applications in longitudinal observations. DXA seems to be more precise in overweight or obese subjects and when used for local measurements of larger body regions. Level of evidence: Level III: Evidence obtained from well-designed cohort analytic study.
Body composition, densitometry, dual-energy X-ray absorptiometry, precision
INTRODUCTION
Dual-energy X-ray absorptiometry (DXA) is one of the methods commonly used to assess body composition [1]. It is rapid, relatively inexpensive and provides accurate information on both bone mineral content (BMC) and bone mineral density (BMD), as well as soft- tissue content of the whole-body and regions (arms, legs, and trunk). Modern scanners (such as Lunar iDXA that we used in this study) may also precisely measure the visceral (intra-abdominal) adipose tissue weight and volume [2]. Technological progress shortened acquisition (scanning) time, increased resolution, and minimalized radiation dose, which allows repeated measurements. In clinical practice, these repeated measurements are often necessary for a proper serial monitoring of body compositions changes (e.g., in athletes or during weight-loss interventions). This poses another requirement for DXA scanners: Low variability and high intertest precision to detect minimal clinically significant changes. DXA precision for the assessment of BMC/BMD has been previously reported in several papers [3-5]. However, less is known about its adipose tissue quantification precision in non-athletic healthy general population, especially regarding the visceral adipose tissue (VAT).
Therefore, the primary study objective was to determine the precision of peripheral and VAT quantification using Lunar iDXA in two consecutive measurements. The second objective was to determine if body mass index (BMI) may affect the precision of body fat quantification in repeated measurements.
MATERIALS AND METHODS
This was a retrospective study, based on data collected on calibration of the iDXA equipment. For this type of study formal consent is not required. 139 non-athletic, adult (age ≥ 18 years) European Caucasian women were included in the study. The size of the study sample was determined on the basis of maximum subjects we could enroll in the project within a given period of time (12 months). All volunteers had neither self-reported personal or familial psychiatric history nor medication history from semi-structured interview and had normal laboratory findings. All subjects had blood profile, alanine aminotransferase, aspartate transaminase, urea, creatinine, bilirubin, and electrolytes which were in the normal range. Subjects with acute and chronic inflammatory conditions (e.g., pneumonia and rheumatoid arthritis), immunological disorders (e.g., AIDS and allergy), and cancer were excluded from the study. There was no external funding for the study. All procedures performed in studies involving human participants were in accordance with the ethical standards of the institutional and/or national research committee and with the 1964 Helsinki Declaration and its later amendments or comparable ethical standards. Due to retrospective study design, formal consent was not required.
Body composition was measured using GE Healthcare Lunar iDXA densitometer (GE Healthcare, UK) with enCORE software (version 15 SP2). Standard operating conditions (including preparation of the participants and measurement procedures) were monitored by a trained technician. Calibration was performed daily using a calibration block consisting of tissue-equivalent materials with three bone-simulating chambers and standards for body composition, as supplied by the manufacturer. The following standard regions of interest (ROI) were measured: Right arm fat, left arm fat, right leg fat, left leg fat, trunk fat, android fat, gynoid fat, total fat, VAT mass, and VAT volume. The android ROI is representative of where many men preferentially store excess body fat. The base of the android ROI sits immediately above the pelvis and is equal in height to 20% of the distance from the pelvis to the chin. The gynoid ROI is representative of where many women preferentially store excess body fat. The android and gynoid ROI are separated by a distance equal to 1.5 times the height of the android ROI, while the height of the gynoid ROI is double that of the android ROI.[6] All DXA measurements were performed 2 times, with up to 10 min of interval and with repositioning between scans. All tests were performed by the same trained technician. For all study subjects, we used automatic ROI analysis mode of enCORE software.
Height was measured with a wall-mounted height measure to the nearest 0.5 cm. Weight was measured with a seca 955 (Seca, UK) digital chair scale that was kept on a firm horizontal surface, with subjects undressed. BMI was calculated as body weight in kilogram divided by the height in meter squared (kg/m2). BMI subgroups were defined according to the WHO recommendations (normal: < 25 kg/m2, overweight: = 25 and < 30 kg/m2, ans obesity =30 kg/m2).
Statistical procedures were performed with STATA 15.1 (StataCorp, USA) and Prism 7.04 (GraphPad Software, USA). Simple descriptive statistics (means, standard deviations, and 95% confidence intervals) were generated for all variables. The precision of repeated measurements was assessed using the following methods: Within-subject percentage coefficient of variation (%CV, calculated using root mean square method), Bland-Altman plots, bias and 95% limits of agreement, and Pearson's correlation. Unadjusted logistic regression models were run in BMI subgroups for the association between individual measurements.
RESULTS
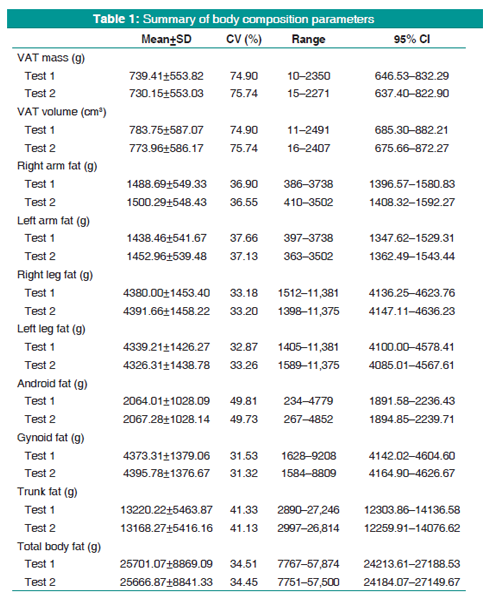
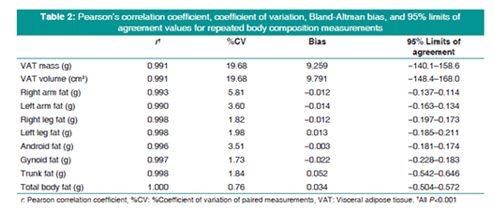
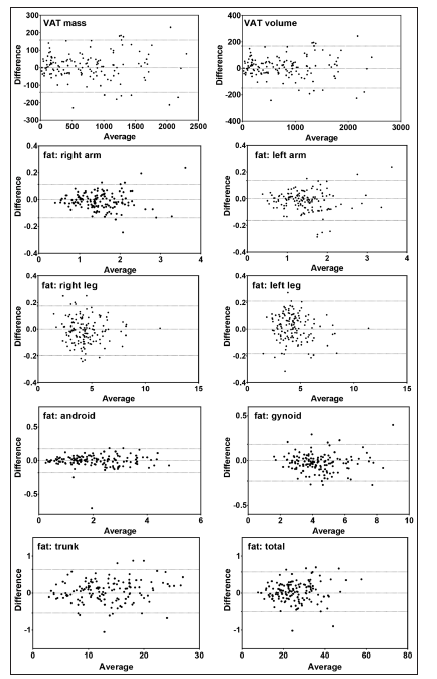
Mean age of the study subject was 47.1 ± 9.9 (range: 20-71) years and mean BMI 25.1 ± 4.3 (range 16.3-38.1) kg/m2. A detailed summary of the body composition results is shown in Table 1. Pearson's correlation coefficients, %CV, Bland- Altman bias, and 95% limits of agreement values varied between the different regions. Table 2 shows Pearson correlation coefficients, Bland-Altman bias, and 95% limits of agreement, while graphical evaluation of repeatability (Bland-Altman plots) is shown in Figure 1.
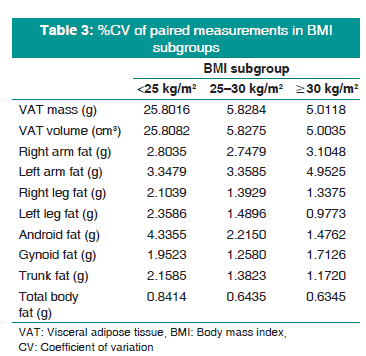
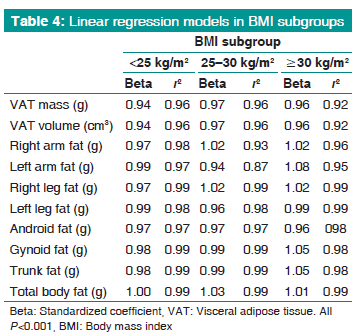
We tested whether BMI value may affect the precision of adipose tissue quantification using DXA method. Study subjects were stratified according to their BMI: Normal n = 78 (56.12%), overweight n = 43 (30.94%), and obesity n = 18 (12.95%). All tested body composition parameters are strongly correlated with BMI value (r > 0.8, P < 0.001 for all correlations). We have calculated %CV values for individual regions and compared them between BMI subgroups. Results of this analysis are shown in Table 3. Furthermore, in these three subgroups, we have run logistic regression models (non-adjusted) for individual ROIs and total body fat. These models are presented in Table 4.
DISCUSSION
Precise repeatability of body composition assessment is crucial for longitudinalobservations. Furthermore, differences in precision between individual ROIs may be significant for studies focused on particular regions (e.g., VAT). The first objective of this study was to evaluate the precision of repeated peripheral and VAT quantification using Lunar iDXA densitometer. We found that, for peripheral adipose tissue, intertest precision is high, indicated by %CV, Bland-Altman plots, bias, and 95% limits of agreement values. Observed %CV values are generally in agreement with previous studies (in which values < 4% were mostly reported) [7-11]. While there are differences between individual studies, they may be explained by different populations, the type of densitometer used, and regions studied. Nevertheless, available data indicate sufficient total body and regional precision for iDXA. However, since there is no a conventional value accepted for the precision and reliability of these measures, for certain clinical applications, iDXA precision may not be acceptable. Consistently with previous reports, for example, by Buehring et al.,[8] we have found that precision was lower for smaller regions (such as arms or android ROI) compared with larger regions (such as the total body, legs, or trunk), with approximately 2-fold difference between these. This is clearly visible in Table 2, where lowest Pearson's correlation coefficient and highest %CV values are for the VAT and both arms, while highest Pearson's correlation coefficient and lowest %CV values are not only for the total body fat, legs, and trunk but also for gynoid region, which is relatively large (comparable with legs, Table 1). This indicates that, for peripheral body fat, precision of repeated DXA quantification is high and sufficient for clinical needs.
Regarding VAT, single measurements were validated against magnetic resonance imaging (MRI)[12,13] and computed tomography (CT),[14] showing good precision. However, studies of repeated precision of VAT quantification are very limited. We have found that %CV, bias, and 95% limits of agreement values were much higher compared to other body regions. This indicates that differences between two consecutive measurements of VAT mass or volume are higher. Practically, lower precision for repeated quantification might mask clinical changes in long-term observations, if these changes were relatively small. Two potential explanations are available. First and foremost, this may result from technological limitations of DXA imaging. VAT is highly tridimensional, while DXA images are two-dimensional. Therefore, the CoreScan technology (used in Lunar iDXA densitometers to quantify VAT) estimates visceral adipose region volume on the axis perpendicular to the image plane. The distribution of VAT in the abdomen is inhomogeneous and may introduce great variation between the planimetric measurements performed at different anatomical levels [15]. Second explanation results from the observation (also confirmed in our study) that DXA measurements are less precise for smaller regions. In our study sample, VAT was the smallest analyzed region [Table 1], and therefore, the precision of its quantification was also lowest. Another finding described below may also affect the precision of VAT quantifications.
The secondary objective of our study was to evaluate whether BMI may affect the precision of DXA measurements. Since subjects with higher BMI usually have larger amounts of body fat (unless they are athletes), precision of DXA measurements should be higher in these subjects. Previously, Bredella et al. found that precision of DXA was higher in subjects with higher BMI,[16] although in another study, it was found that DXA may not precisely assess body composition in markedly obese women [17]. There was a 4-fold difference in the average amount of VAT between normal BMI and obese sub-groups (383.55 ± 285.22 vs. 1560.11 ± 417.83 g) and only a 2-fold difference for total body fat (19760.09 ± 4750.05 vs. 41472.66 ± 6091.08 g).
When we have compared precision of measurements in three different BMI subgroups (normal, overweight, and obesity), VAT measurements were much less precise for normal BMI subgroup than for other regions [Table 3], while for other subgroups, differences in precision were much lower.
CONCLUSION
WWe may state that repeated DXA body composition measurements have a relatively high precision and therefore may be a useful option for repeated measurements of visceral adiposity [9]. However, for VAT measurements, its precision is lower, and therefore, it may limit its applications in longitudinal observations. Furthermore, DXA seems to be more precise in overweight or obese subjects and when used for local measurements of larger body regions. Major limitation of our study is that it only included women. Furthermore, individual BMI subgroups were relatively small (especially, for overweight and obese subgroups). We could not find GE Healthcare Lunar iDXA algorithm for measuring VAT; therefore, we cannot confirm that it is directly measured and not calculated, i.e., by subtraction of the other compartments from total body fat. If the latter, arguments presented here apply more to the other truncal or gynoid ROIs.
The strength of this study is large, mostly homogenous study sample, consisting of only healthy, non-athletic adult women. This is also its major weakness since we do not know whether obtained results could be applied to DXA body composition measurements in men or in different populations (e.g., athletes or severely obese subjects). Further studies in these populations are therefore recommended.
REFERENCES
- Seabolt LA, Welch EB, Silver HJ. Imaging methods for analyzing body composition in human obesity and cardiometabolic disease. Ann N Y Acad Sci 2015;1353:41-59.
- Kaul S, Rothney MP, Peters DM, Wacker WK, Davis CE, Shapiro MD, et al. Dual-energy X-ray absorptiometry for quantification of visceral fat. Obesity (Silver Spring) 2012;20:1313-8.
- Hind K, Oldroyd B, Truscott JG. In vivo precision of the GE lunar iDXA densitometer for the measurement of total-body, lumbar spine, and femoral bone mineral density in adults. J Clin Densitom 2010;13:413-7.
- Hind K, Oldroyd B, Prajapati A, Rhodes L. In vivo precision of dual-energy X-ray absorptiometry-derived hip structural analysis in adults. J Clin Densitom 2012;15:302-7.
- Carver TE, Christou NV, Court O, Lemke H, Andersen RE. In vivo precision of the GE lunar iDXA for the assessment of lumbar spine, total hip, femoral neck, and total body bone mineral density in severely obese patients. J Clin Densitom 2014;17:109-15.
- Gaida JE, Alfredson H, Kiss ZS, Bass SL, Cook JL. Asymptomatic Achilles tendon pathology is associated with a central fat distribution in men and a peripheral fat distribution in women: A cross sectional study of 298 individuals. BMC Musculoskelet Disord 2010;11:41.
- Hind K, Oldroyd B, Truscott JG. In vivo precision of the GE lunar iDXA densitometer for the measurement of total body composition and fat distribution in adults. Eur J Clin Nutr 2011;65:140-2.
- Buehring B, Krueger D, Libber J, Heiderscheit B, Sanfilippo J, Johnson B, et al. Dual-energy X-ray absorptiometry measured regional body composition least significant change: Effect of region of interest and gender in athletes. J Clin Densitom 2014;17:121-8.
- Rothney MP, Martin FP, Xia Y, Beaumont M, Davis C, Ergun D, et al. Precision of GE lunar iDXA for the measurement of total and regional body composition in nonobese adults. J Clin Densitom 2012;15:399-404.
- Cordero-MacIntyre ZR, Peters W, Libanati CR, Espana RC, Abila SO, Howell WH, et al. Reproducibility of DXA in obese women. J Clin Densitom 2002;5:35-44.
- Hsu FC, Lenchik L, Nicklas BJ, Lohman K, Register TC, Mychaleckyj J, et al. Heritability of body composition measured by DXA in the diabetes heart study. Obes Res 2005;13:312-9.
- Neeland IJ, Grundy SM, Li X, Adams-Huet B, Vega GL. Comparison of visceral fat mass measurement by dual-X- ray absorptiometry and magnetic resonance imaging in a multiethnic cohort: The Dallas heart study. Nutr Diabetes 2016;6:e221.
- Belcher SL, Kindler JM, Pollock NK, Ross HL, Modlesky CM, Laing EM, et al. Comparison of MRI and DXA for measurement of visceral adipose tissue in adolescent females. FASEB J 2016;30:686-8.
- Olarescu NC, Jorgensen AP, Godang K, Jurik AG, Froslie KF, Bollerslev J, et al. Dual-energy X-ray absorptiometry is a valid method to estimate visceral adipose tissue in adult patients with prader-willi syndrome during treatment with growth hormone. J Clin Endocrinol Metab 2014;99:E1727-31.
- Maurovich-Horvat P, Massaro J, Fox CS, Moselewski F, O'Donnell CJ, Hoffmann U, et al. Comparison of anthropometric, area-and volume-based assessment of abdominal subcutaneous and visceral adipose tissue volumes using multi-detector computed tomography. Int J Obes (Lond) 2007;31:500-6.
- Bredella MA, Gill CM, Keating LK, Torriani M, Anderson EJ, Punyanitya M, et al.Assessment of abdominal fat compartments using DXA in premenopausal women from anorexia nervosa to morbid obesity. Obesity (Silver Spring) 2013;21:2458-64.
- Bredella MA, Ghomi RH, Thomas BJ, Torriani M, Brick DJ, Gerweck AV, et al. Comparison of DXA and CT in the assessment of body composition in premenopausal women with obesity and anorexia nervosa. Obesity (Silver Spring) 2010;18:2227-33.