ST-segment Depression: All are Not Created Equal!
Sonia Mishra1, Ajay Mishra2, Jagdish Mishra3
2.Georgetown University, Washington, DC 20057 USA,
3.Upstate Cardiology, 215 Summit St, Batavia, New York 14020, USA
Citation : Mishra S, Mishra A, Mishra J. ST-segment Depression: All are Not Created Equal! J Clin Cardiol Diagn 2018;1(1):1-6.
ST depression on an electrocardiography can be from various causes including ischemia, acute coronary syndrome, electrolyte imbalance, posterior myocardial infarction, pulmonary embolism and others. Making the right diagnosis and therefore the right treatment is of paramount importance. This article goes into depth explaining why all ST-segment depressions are not created equal.
ST Segment depression. Ischemia. Acute coronary syndrome,Cardiology, Diagnostics
INTRODUCTION
Three most relevant tools available to an emergency room physician from cardiac perspective are patient's pertinent symptoms/complaints, 12-lead electrocardiography (ECG), and cardiac markers. While waiting for the blood test reports including cardiac enzymes to come in, a 12-lead ECG can be very helpful in guiding the immediate course of treatment especially in patients with ST-segment deviation: Elevation versus depression. We almost always know what to do with ST-segment elevation; however, ST-segment depression might not be always helpful as noted in the following two cases that presented to the emergency department.
CASE REPORT
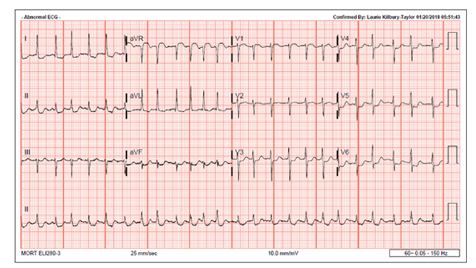
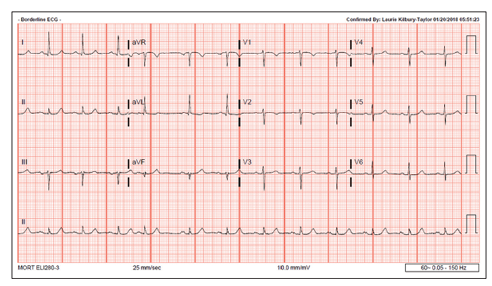
A 78-year-old lady woke up at 11 pm with palpitations, shortness of breath. She lives 5 min away from the hospital and therefore decided to drive down to the local emergency room where she was found to be in atrial fibrillation with the rapid ventricular rate. She has a history of hypertension and dyslipidemia. Her 12-lead ECG also revealed generalized ST-segment depression in almost all leads except aVR where there was about 2 mm ST-elevation. She converted back to normal sinus rhythm in ER, and her ST depression (STD) resolved. Her troponin was mildly elevated as well. Therefore, she underwent diagnostic coronary angiography revealing 2-vessel coronary artery disease (CAD) (left circumflex and right coronary artery [RCA]) requiring two coronary stents Figures 1 and 2.
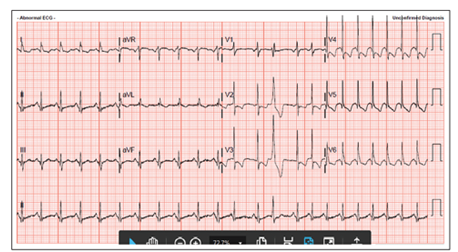
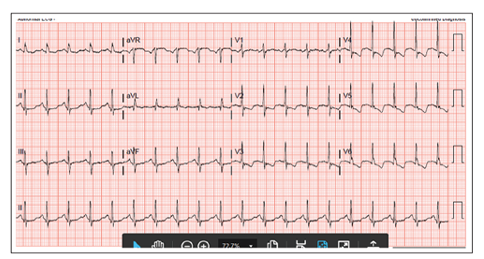
A 58-year-old lady known with chronic obstructive pulmonary disease and CAD presented to the emergency room with syncope, palpitations, with shortness of breath while at a local casino. A day before she was seen in our office for her routine visit. She was found to have mild sinus tachycardia at 105-110 beats/min without any symptoms. Her metoprolol was increased due to her sinus tachycardia in the setting of a known CAD. She has had last coronary angiography in 2012 with totally occluded right coronary stent (RCA), and 40% proximal left anterior disease (LAD). She has been medically managed since then for CAD, hypertension, and dyslipidemia.
This visit she presented with sinus tachycardia at the rate of 140 bpm with diffuse ST-segment depression. Her troponin was minimally elevated. Her heart rate had come down, but significant STD continued and therefore in this setting of a known CAD from before with now shortness of breath, palpitations, syncope, mildly elevated troponin, and persistent STD, she underwent coronary angiography. Her RCA stent was occluded, and there were no new and significant coronary lesions requiring stenting Figures 3 and 4.
Both these cases discussed above were high risk for CAD presenting with symptoms, tachycardia, elevated troponins and marked STD. However, one patient had 2-vessel CAD requiring two stents, and another patient showed no new coronary lesions!
How did this happen? Why not both patients had similar catheterization findings when their symptoms and objective findings were the same?
We will come back to this question later.
ST segment on 12-lead ECG represents the plateau phase of ventricular repolarization (phase 2 of the action potential curve) while the T wave represents the rapid ventricular repolarization (phase 3). When ST and T wave changes are secondary to depolarization abnormalities (QRS affected), these are known as secondary ST/T changes. On the other hand, when ST and T wave changes are not related to QRS abnormalities, then these are known as primary repolarization changes[1]. Ischemia, pericarditis, myocarditis, some medications, and electrolyte abnormalities will cause primary ST/T changes.
STD due to ischemia is this situation is mostly diffuse and does not localize the coronary artery zone. STD of at least 1.0 mm at the J point and horizontal or downward sloping STD are the criteria needed to call it diagnostic of myocardial ischemia[2]. These kinds of ST/T changes in the setting of the clinical history of the acute coronary syndrome are considered adverse prognostic factors and warrant aggressive management.
Unlike ST-segment elevation, STD does not localize ischemia[3]and this has been studied quite extensively but without any proper explanation. The extent and the magnitude of STD, however, can correlate with the extent and the severity of underlying ischemia. Few studies have shown that STD in eight or more leads combined with ST elevation in leads aVR and V1 occurring during chest pains or treadmill stress test is associated with a 75% predictive accuracy for left main coronary artery or 3-vessel disease[4-6].
Similar findings were noted in cases of very critical proximal stenosis of the left anterior descending coronary artery[7].
STD could be of three kinds with a treadmill stress test and in many pathological situations: Upsloping, horizontal, and downsloping ST-segment depression. Upsloping ST-segment depression lacks any specificity and is generally considered benign. Downsloping ST-segment depression is worse for prognosis and more specific for diagnosis than horizontal STD.
Following findings on a treadmill stress test could be considered highly suggestive of significant CAD[8]:
1. Horizontal STD of 2 or more mm
2. Downsloping STD
3. Early positive response within 6 min
4. Persistence of STD for more than 6 min into recovery
5. STD in 5 or more leads
6. Exertional hypotension.
Biphasic or deeply inverted (>5 mm) T waves in leads V2-3 and at times with similar changes in V1 and V4-5 are very characteristic of recent ischemia/injury in the left anterior descending artery territory, and these findings are called Wellens' syndrome[9]. It has been shown that 75% of patients who developed these T wave changes and was treated medically without coronary intervention (angioplasty/stent) developed extensive anterior wall myocardial infarction within a mean of 8.5 days[10].
These ST/T changes are seen hours or days after the ischemic chest pain resolves. The ischemic episode is usually associated with transient ST elevation or depression that progresses to T wave abnormalities as noted above after chest pain resolution[11]. As originally described, only 12% of these patients had a small increase in their cardiac enzymes, and therefore, ECG may be the only indication of an impending large anterior infarction in a chest pain-free patient[9].
First described by De Winter et al. in 2008 representing 2% of all acute LAD occlusions (unlike Wellens syndrome that represents subacute LAD occlusion) with key diagnostic ECG features of STD at the J point, 1-3 mm and tall, peaked and symmetric T waves in precordial leads along with aVR lead showing mild ST elevation[12]. It has been proposed to be called as anterior ST-elevation myocardial infarction equivalent[13].
Most cases of acute posterior wall MI are due to the critical lesions in a dominant right coronary or left circumflex artery. This kind of acute myocardial infarction (AMI) can occur in up to 12% of total AMIs with most cases occurring in the setting of inferior or lateral MIs. Isolated posterior MIs are rare but do occur[14]. ECG changes suggestive of a posterior wall AMI:[15] 1. A horizontal STD with tall, upright T waves in the right precordial leads, V1-3. 2. A tall, wide R wave in V1-3. 3. An R/S wave ratio >1 in lead V2.
STD in the right precordial leads may represent either reciprocal changes secondary to inferior or lateral AMI or may be due to the posterior wall AMI. In addition to these changes, if we see >1 mm ST elevation in the posterior leads V7-9, that will confirm the presence of posterior wall AMI[16]. Therefore, STD that is most prominent in V1-3 is often suggestive of posterior wall STEMI rather than NSTE ischemia and indicates the need for emergent coronary angiography. One study has shown that STD in the precordial leads was as sensitive (80%) as ST elevation in posterior leads, V7-9 for the diagnosis of posterior wall AMI[17].
Reciprocal STD or "reciprocal change" or "mirror image" is defined as horizontal or downsloping STD in separate leads from those showing ST elevation. While ST elevation is considered the primary ischemic change, STD is considered a reciprocal change. The exact cause of this phenomenon is unknown; however, it is thought secondary to distant ischemia in a patient with a multi-vessel CAD,[18] or an infarct extension or an electrophysiological phenomenon caused by displacement of injury current away from the non-infarcted myocardium[19]. Reciprocal STD can be present in almost all cases of inferior MI and 70% of patients with anterior AMI[20]. The presence of reciprocal change increases the positive predictive value for AMI diagnosis to over 90%[21].
In anterior myocardial infarction, STD seen in inferior leads might be corresponding to contributions of the basal anterolateral region supplied by the first diagonal branch and seen as ST elevation in leads I and aVL[18].
In inferior wall MI, the presence of STD in lead aVL and also in V1-3 is generally considered reciprocal changes[19]. However, in these patients, the STD in leads V4-6 could be associated with LAD stenosis or 3-vessel CAD representing ischemia at a distance.[20a]
Patients with anterior or inferior wall MI with reciprocal STD have lower ejection fraction compared to those without reciprocal STD[20].
Sinus tachycardia is the most common ECG abnormality in cases of acute pulmonary embolism. Other findings could include: T-wave inversion in V1-4 and also in III and aVF[22,23].
There are ST/T waves changes in as much as 70% cases of LVH[24]and these STD/repolarization changes are known as "strain pattern". The strain pattern has a sensitivity of 52% and specificity of 95% to diagnose LVH. T-wave inversion is greater in lead V6 compared to V4 with more than 3 mm STD in lead V6. These STD could very easily be confused with ischemic changes.
There are ST/T changes discordant with the axis of LBBB or RBBB, and these changes are expected and known as repolarization abnormalities. However, if ST/T changes are concordant (ST/T axis in the same direction as BBB), these are known as primary changes and considered ischemic in nature[25].
This ECG situation occurs when the T waves are inverted in most of the leads except aVR and QT interval is generally prolonged. These T wave inversions are most symmetric and deep (>10 mm). These patterns are usually seen in significant myocardial ischemia or intracranial bleeding. Other conditions where these patterns are seen include: Hypertrophic cardiomyopathy, stress cardiomyopathy, advanced AV conduction block, pulmonary embolism, pericarditis, and cocaine abuse[26].
Digoxin can produce PR prolongation (vagal effect), STD, inverted T waves, prominent U waves and can also shorten the QT interval. Digoxin effect is usually seen in inferolateral leads as "scooped" STD.
Classically, hypokalemia is known by STD, T wave flattening and prominent U waves along with the QT interval prolongation[27].
CONCLUSION
It is so vital to have an extensive knowledge of ECG changes in relation to STD as being part of life-threatening conditions such as posterior MI, pulmonary embolism, or acute coronary syndrome. It will drastically change our course of action and short-term prognosis of the patients. In addition, it is quite helpful to know if these ST abnormalities are secondary repolarization changes or associated with LVH, digoxin effect, electrolyte imbalance, or BBB.
STD may certainly indicate the extent and severity of ischemia, but it does not localize the site (coronary artery) of ischemia. Why it does not localize the site of ischemia-like ST elevation remains unexplained so far.
REFERENCES
- Hanna EB, Glancy DL. ST depression and T wave inversion: Classification, differential diagnosis and caveats. Cleve Clin J Med 2011;78:404-14.
- Wagner GS. Marriott's practical ECG. 9th ed. Baltimore: Williams and Wilkens; 1994.
- Li D, Li CY, Yong AC, Kilpatrick D. Source of electrocardiographic ST changes in subendocardial ischemia. Circ Res 1998;82:957-70.
- Gorgels AP, Vos MA, Mulleneers R, de Zwaan C, Bar FW, Wellens HJ, et al. Value of the electrocardiogram in diagnosing the number of severely narrowed coronary arteries in rest angina pectoris. Am J Cardiol 1993;72:999-1003.
- Glancy DL. ECG diagnosis of acute myocardial infarction. J LA State Med Soc 2002;154:66-75.
- Mishra S, Mishra A, Mishra JP. Why not a stress test in an asymptomatic person? "The world is drowning". Cardiovasc Thorac Surg 2017;2:4.
- Yamaji H, Iwasaki K, Kusachi S, Murakami T, Hirami R, Hamamoto H, et al. Prediction of acute left main coronary artery obstruction by 12-lead electrocardiography. ST segment elevation in lead aVR with less ST segment elevation in lead V(1). J Am Coll Cardiol 2001;38:1348-54.
- Hill J, Timmis A. Exercise tolerance testing. BMJ 2002;324:1084-7.
- Lilaonitkul M, Robinson K, Roberts M. Wellens' syndrome: Significance of ECG pattern recognition in the emergency department. Emerg Med J 2009;26:750-1.
- de Zwaan C, Bar FW, Wellens HJ. Characteristic ECG pattern indicating a critical stenosis high in left anterior descending artery in patients admitted because of impending myocardial infarction. Am Heart J 1982;103:730-6.
- de Zwaan C, Bar FW, Janssen JH, Cheriex EC, Dassen WR, Brugada P, et al. Angiographic and clinical characteristics of patients with unstable angina showing an ECG pattern indicating critical narrowing of the proximal LAD coronary artery. Am Heart J 1989;117:657-65.
- De Winter R, Verouden NJ, Wellens HJ, Wilde AA. A new ECG sign of proximal LAD occlusion. N Engl J Med 2008;359:2071-3.
- Rokos IC, French WJ, Mattu A, Nichol G, Farkouh ME, Reiffel J, et al. Appropriate cardiac cath lab activation: Optimizing electrocardiogram interpretation and clinical decision-making for acute ST-elevation myocardial infarction. Am Heart J 2010;160:995-1003, 1003.e1-8.
- Goldberger A. Myocardial Infarction: ECG Evolution of Posterior Acute Myocardial Infarction: ECG Differential Diagnosis. 4th ed. St Louis: Mosby; 1991.
- Brady WJ. Acute posterior wall myocardial infarction: ECG manifestations. Am J Emergen Med 1998;16:409-13.
- Eisenstein I, Sanmarco ME, Madrid WL, et al. ECG and vectorographic diagnosis of posterior acute myocardial infarction: Significance of T wave. Chest 1985;88:409.
- Matetzky S, Freimark D, Chouraqui P, Rabinowitz B, Rath S, Kaplinsky E, et al. Significance of ST segment elevations in posterior chest leads (V7 to V9) in patients with acute inferior myocardial infarction: Application for thrombolytic therapy. J Am Coll Cardiol 1998;31:506-11.
- Norell MS, Lyons JP, Gardener JE, Layton CA, Balcon R. Significance of reciprocal ST depression: Left ventriculographic observations during left anterior descending coronaryy angioplasty. J Am Coll Cardiol 1989;13:1270-4. (a). Arbane M, Goy JJ. Prediction of the site of total occlusion in the LAD artery using the admission ECG in anterior wall acute myocardial infarction. Am J Cardiol 2000;85:487-91.
- Aufderheide TD, Brady WJ. ECG in patients with myocardial ischemia or infarction. In: Gibler WB, Aufderheide TP, editors. Emergency Cardiac Care. 1st ed. St Louis: Mosby; 1994. p. 169-216. (a). Peterson ED, Hathaway WR, Zabel KM, Wagner GS, Granger CB, Pieper KS, et al. Prognostic significance of precordial ST depression during inferior wall MI in the thrombolytic era: Results in 16521 patients. J Am Coll Cardiol 1996;28:305-12.
- Surawicz B, Knilans TK. Acute Ischemia: ECG Patterns. Chou's ECG in Clinical Practice: Adult and Pediatric. 5th ed. Philadelphia: WB Saunders; 2001. p. 122-53. (a). Bimbaum Y, Wagner GS, Barbash GI, et al. Correlations of angiographic findings and right (V1-3) versus left (V4-6) precordial ST depression in acute IWMI. Am J Cardiol 1999;83:143-8.
- Brady WJ. Mastering the ECG: State-of-the-art technique for evaluating ST elevation in acute myocardial infarction and other clinical syndromes. Emerge Med Rep 1998;19:78-93. (a) Zoghi M, Gurgun C, Yavuzgil O, Turkoglu I, Kultursay H, Akilli A, et al. The angiographic correlation between ST segment depression in noninfarcted leads and the extent of coronary artery disease in patients with acute inferior myocardial infarction: A clue for multivessel disease. Can J Cardiol 2003;19:67-71.
- Ferrari E, Imbert A, Chevalier T, Mihoubi A, Morand P, Baudouy M, et al. The ECG in pulmonary embolism. Predictive value of negative T waves in precordial leads--80 case reports. Chest 1997;111:537-43.
- Sreeram N, Cheriex EC, Smeets JL, Gorgels AP, Wellens HJ. Value of 12-lead ECG at hospital admission in the diagnosis of pulmonary embolism. Am J Cardiol 1994;73:298-303.
- Brady WJ, Chan TC, Pollack M. ECG manifestations: Patterns that confound the EKG diagnosis of acute myocardial infarction-LBBB, ventricular paced rhythm, and LVH.J Emergen Med 2000;18:71-8.
- Shapiro NI, Fisher J, Zimmer ZD, Validation of ECG criteria for diagnosing acute myocardial infarction in the presence of left bundle branch block. (abstract). Acad Emerg Med 1998;5:508.
- Walder LA, Spodick DH. Global T wave inversion. J Am Coll Cardiol 1991;17:1479-85.
- Diercks DB, Shumaik GM, Harrigan RA, Brady WJ,Chan TC. Electrocardiographic manifestations: Electrolyte abnormalities. J Emerg Med 2004;27:153-60.